“Portfolio Design, Position Sizing, and Risk-Reward.
Master the Holy Trinity of Trading and you shall succeed.”
— Tackle daily email: January 9th, 2019 —
This edition of the Trading Justice Newsletter is the second of a three-part series we are calling The Holy Trinity of Trading. The argument laid out in last month’s edition is still valid: Although not the ultimate opus or the definitive guide to these complex subjects, this is our modest contribution to the search for the Holy Grail of Investing: how successful traders and investors are born.
Here’s the Holy Trinity of Trading roadmap, so far:
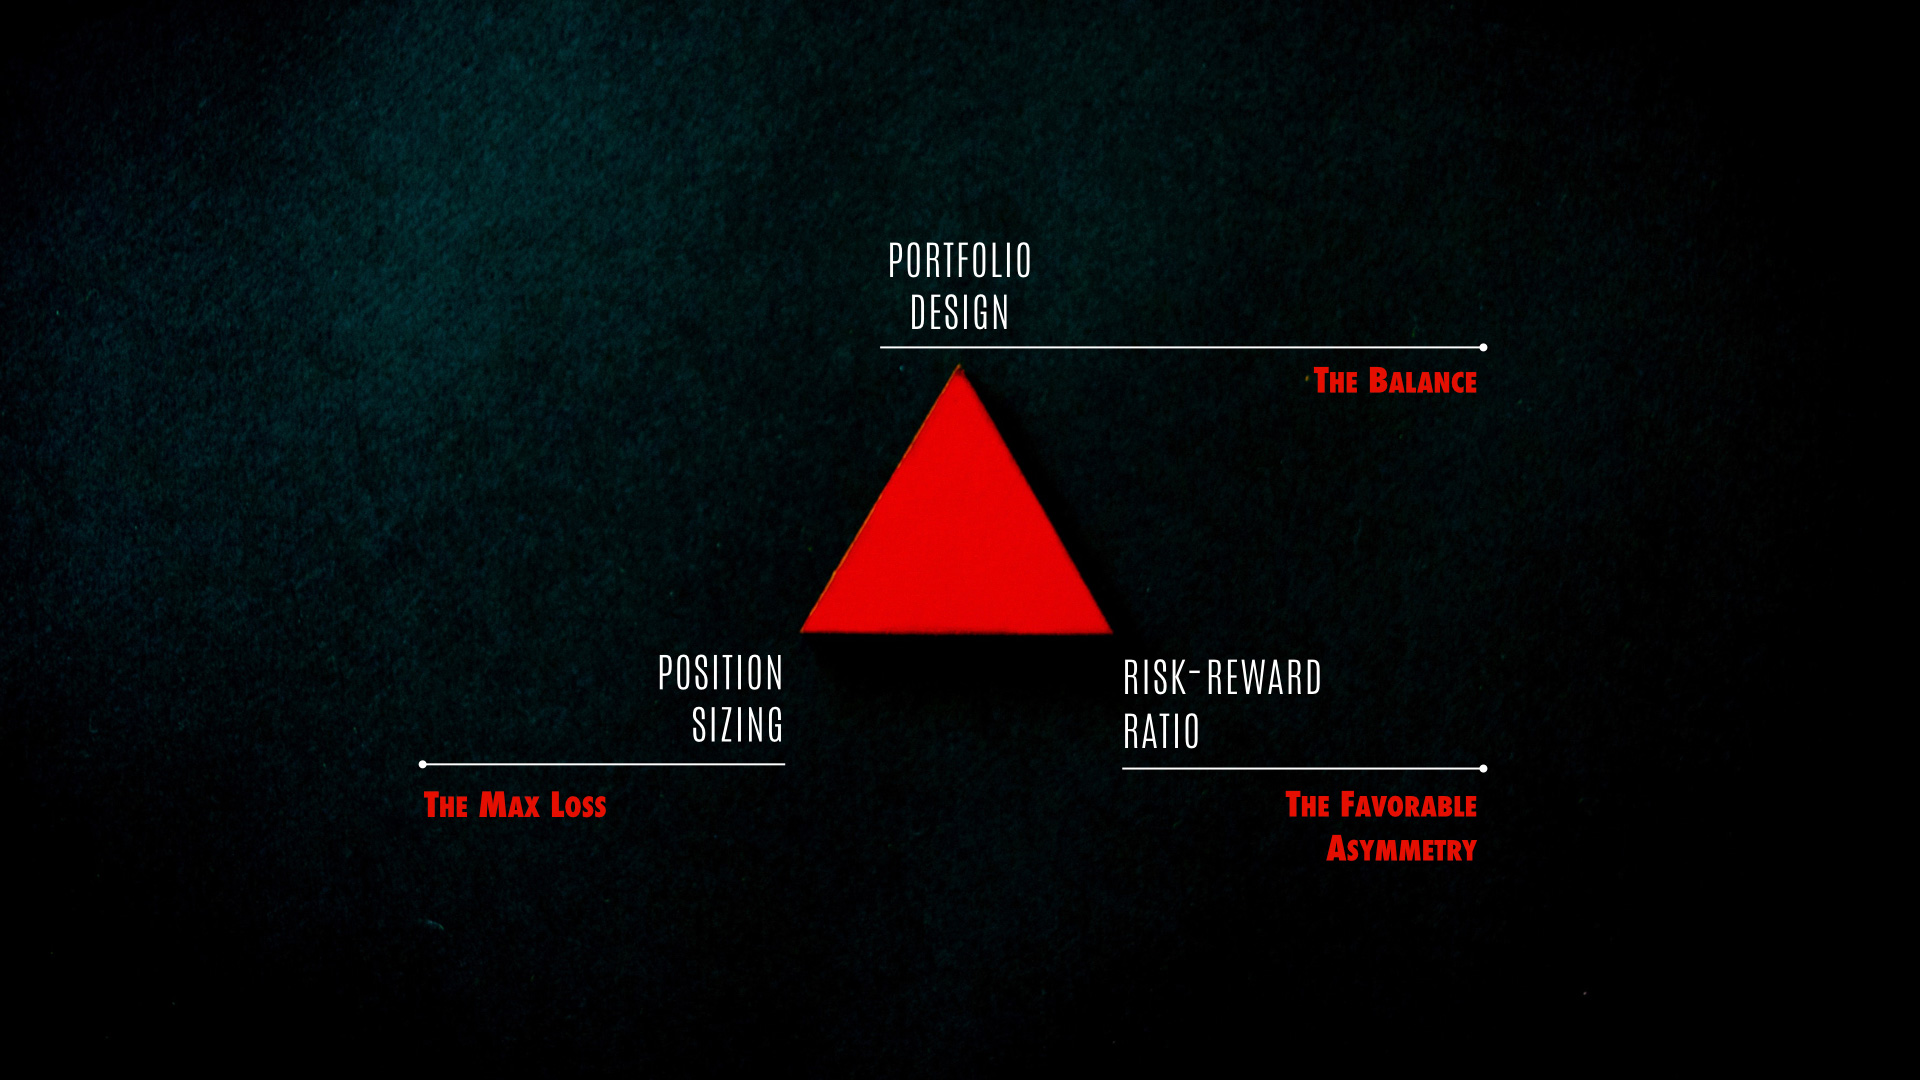
Portfolio Design represents the balance inside the Trinity. This is the topic we’ll be discussing in this edition (February 2019). CHECK ✅
Position Sizing (also called Money Management) represents the max loss inside the Trinity. This topic will be discussed in the March 2019 edition. YOU ARE HERE 📍
Risk-Reward Ratio (also called Reward to Risk Ratio) represents the favorable asymmetry inside the Trinity and is reserved for the April 2019 edition.
Last month, we’ve mentioned that if you search for Holy Trinity on the internet you will find quite an impressive number of resources, ranging from religious texts to the Matrix, from marketing to investing. Nothing has changed ever since. We didn’t change either, the Trading Justice version of the Holy Trinity is still intact:

A Whole New World: Part II
I can open your eyes
Take you wonder by wonder
Over sideways and under
On a magic carpet ride
Our approach to Position Sizing is ridiculously simple:
We can talk Mathematics. And we probably will. Just a little.
We can talk Probability. And we probably will. Just a little.
We can talk Trading Psychology. And we probably will. Just a little.
We can talk Futurology. We probably won’t.
We can talk Astrology. We probably won’t.
We can talk all things Position Sizing/Money Management and turn this newsletter into a book. That we can do, yes, but we probably won’t.
What we really want—and will certainly do—, is to show you this topic from a whole new perspective. One that is really easy to understand and apply to your trading business. Remember: education without application equals nothing.
A mission assigned is a mission accomplished. Let’s move on.

Don’t walk away
Don’t walk away, don’t say goodbye.
Don’t turn around, don’t let it die.
Position Sizing is so simple that you will probably be offended by its simplicity and want to walk away immediately.
At the very core of it, there are two pillars, two cornerstones, two intrinsic, inseparable and absolute principles that we are going to reveal to you now:
Principle #1: You don’t know the future.
Principle #2: You can claim you know the future, but you can still be wrong about the outcome of the event, both in its nature and impact.
The entire position sizing theory is based on these two principles. We can still play with words, do some mind-stretching exercises, invent rhetorical games, develop some integrals and win the next Nobel Prize, but we are still going to find these two principles at the end of the rainbow, which is good. Complication will do us no good.
The Future is opaque
Reports that say that something hasn’t happened are always interesting to me because as we know, there are known knowns; there are things we know we know. We also know there are known unknowns; that is to say, we know there are some things we do not know. But there are also unknown unknowns – the ones we don’t know we don’t know. And if one looks throughout the history of our country and other free countries, it is the latter category that tends to be the difficult ones.
That’s the United States Secretary of Defense Donald Rumsfeld during the U.S. Department of Defense news briefing on February 12, 2002. His wise words are still echoing in this newsletter, 17 years later.
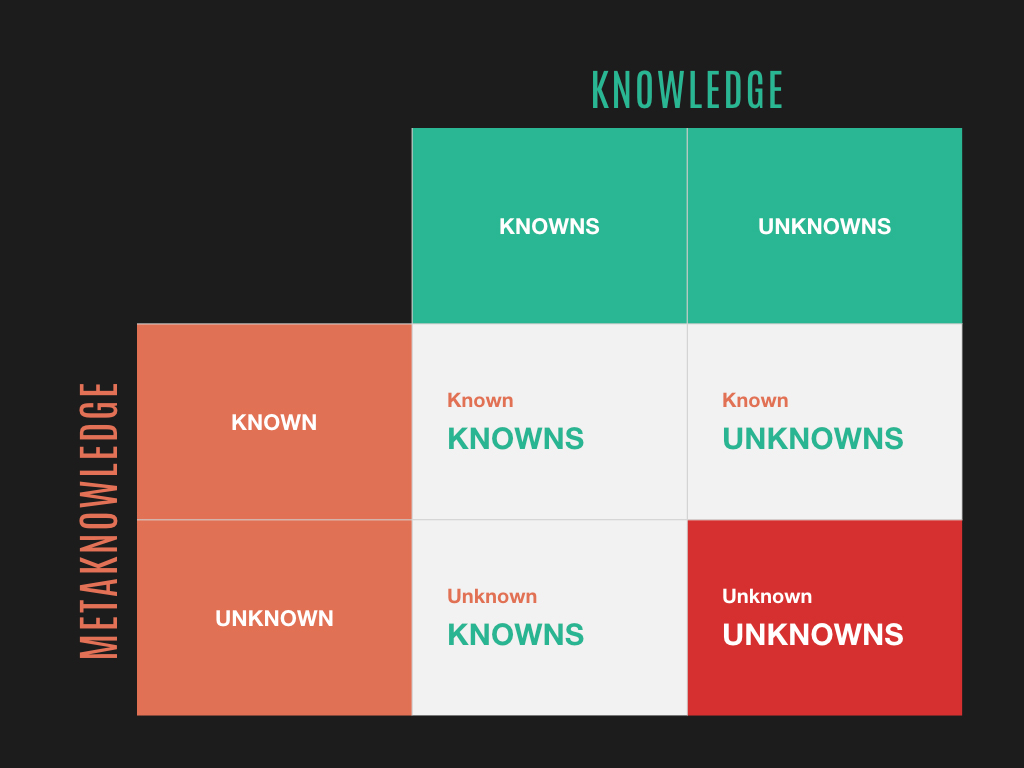
Donald Rumsfeld’s Unknown Unknowns: “It is the latter category that tends to be the difficult ones.”
The future is impenetrable. Opaque. Uncertain. Mysterious. A backwards riddle. Indecipherable. Unstoppable. Uncontrolled.
On the other side of the coin, you have YOU, trader and investor, either a veteran or an apprentice. If the world is X, your interpretation of it is ƒ(X). Your investment thesis is necessarily based on ƒ(X). It will be tested, once set free into the wilderness of the financial markets. It can succeed or get crushed because you can be either right or wrong.
Position sizing is—and I guess will always be—the first and ultimate line of defense against our greatest enemies: the uncertainty of the future and our own convictions.
— How to successfully approach the financial markets as a trader and investor with so much uncertainty? —
That is a legit question. Like many things in life, the solution is built into the problem, though. As traders and investors, we have a built-in advantage—as long as we are not incurring in undefined risk strategies, let us be clear on that— that is, we can only lose –100% of our investment.

The beauty of losing only –100%
Asymmetry is, in its simplest form, the lack of symmetry.
Some professions require symmetry, either structural or aesthetical. Others not only can live without symmetry but are in constant search of a good one. Like us, traders.
How much can a stock fall? –100% should be the max level. There’s no such thing as a negative stock price, so zero should be the ultimate disgrace. Even in the Options world, if you are long an Options position, how much can you lose? Only –100%.
On the other hand, how much can you make? +200%? +330%? +1,000%?
That’s the asymmetry we love. That’s the beauty of the financial markets.
“But losing –100% is too much, don’t you think? It can break you!”, you ponder.
Yes, we understand your point. Losing –100% of anything sounds too much BUT how much is –100%? If –100% is your entire account, yes, my friend, you’re done. But what if –100% equals –$150 in a $20,000 account?
That’s more like it.
Because we are dealing with money, we must not carelessly approach asymmetries. We are not gamblers but professionals. A religious approach is not only suitable but desirable in our case. Limit your –100% and compound your gains over the decades. Handle winners and losers with care. Leave your ego outside the door together with fear, greed, and hope. They do not serve you.
That’s the fertile soil the asymmetry needs to work its magic. We love losing only –100%.

Rhymes and plagiarism
You may be able to predict the occurrence of a war, but you will not be able to gauge its effect.
— Nassim Taleb
You can argue that financial markets tend to repeat themselves. Due in large part to human action—until we get run over by AI—, it surely tends to rhyme and plagiarism. Playing closer to the edge of a rabbit hole, we can argue that some people use the past as a warning of what not to do again in the future, some use it as an SOP for what to do in the future in astonishingly rich details, and some don’t even care about it, repeating it over and over again, blissed in ignorance.
However, the financial market is a place where we have to make serious, carefully well-thought-out decisions every day, as traders and investors, or risk losing everything. In addition to that, the decision making process while trading can be extremely complex, due to the complex nature of the markets. There are two basic types of decisions:
Simple Decisions
The “Yes or Now | True or False” binary type of decision. Either someone is pregnant or not, for example. The magnitude of the True or the False statements is irrelevant in this case.
Complex Decisions
In this type of decisions, there is more to just True or False: the impact is also important and expectation is factored in. This is the type of decisions we make every day while trading and investing. It not only matters if we make or lose money (True or False) but also how many times they happen (Frequency) and the amount made or lost on each position (Expectation).
Please, take a time to follow us on this simple exercise:

Based on the pattern presented, which shape you think is most probable to appear next?

Good. The past repeated itself in the future. You forecasted it right. But what if…

What if this happens? In this situation, you were wrong in the shape but at least right in the color. But what if…

What if this happens? We’ve decided to go rogue on this one, by adding an unexpected shape colored with an (also) unexpected pink color. Your forecast capabilities are not reliable in any capacity. Hang on, because things can get even hairier:

A new pattern developed from the last pink arrow. A new norm started. That is how things are working from now on.
With this exercise, we’ve made our argument on Position Sizing go full-circle. You don’t know the future and even if you claim you know it, you can still be wrong about the outcome of the event, both in its nature and impact. Who can save you from such an oppressive amount of uncertainty?
Only Position Sizing can.
We must never assume there will be a clean and straight road ahead of us just because we are seeing one through the rearview mirror. However loaded with uncertainty, the road ahead is where the profit lies.
With that said, the question you should be asking yourself when confronted with this type of situation shouldn’t be “Which shape will appear next?”. Instead, it should be “How much will I lose if I’m wrong?”.
You can still argue that the probability of such an event happening is very thin. That is when the Extremistan comes in.

Welcome to Extremistan
Get 1,000 people and measure their height and weight. Get the max and min values and then the average. Add to this pool the tallest and shortest individuals you can find. Remake the calculations. Add to this pool the heaviest and the lightest people you can find. Remake the calculations.
I guess you are not going to find that much of a deviation. If you work on developing the normal distribution chart you will see that most of them will gather around the mean. The overall impact of an is not that significant relative to the total.
OK, now let’s do the same with net worth.
Get 1,000 people and calculate their net worth. Get the maximum and minimum values and calculate the average. Now add to the pool only one individual: Bill Gates. One outlier accounts for the whole sample. How much of the total wealth would he represent? 99.9999 percent?
The first case belongs to the Mediocristan World. The latter, to the Extremistan, according to Nassim Taleb.
In the realms of Mediocristan, exceptions occur but don’t carry large consequences. These exceptions can cause large deviations, although not consequential. The same does not happen to the Extremistan.
There is a trap here: we are led to believe that we can apply simple statistical methods to calculate the probability of events occurring in the financial markets, however, there are places where statistics works well and others where it becomes questionable or unreliable. Extremistan is one of these places. Financial markets belong to Extremistan; not only that but they are also ruled by randomness. Here, statistics can fool you. Millions of individuals buying and selling every day, making decisions based on cognitive biases. On such an extreme world, one single day can determine the profits or losses of a whole month. One month can account for the profits or losses of your entire year.
If simple statistical methods are unreliable here and knowledge is questionable or no longer valid, we should have strict policy rules on how to conduct ourselves, what to do and what to avoid. The decision-making process in such a complex environment can be very difficult. Position Sizing becomes your only safety net.
Do you still think this is some doomsday, sky-is-falling approach to trading? Meet some of the recent Extremistan Specimens, then.

Cthulhu by SHadoW-Net on DeviantArt
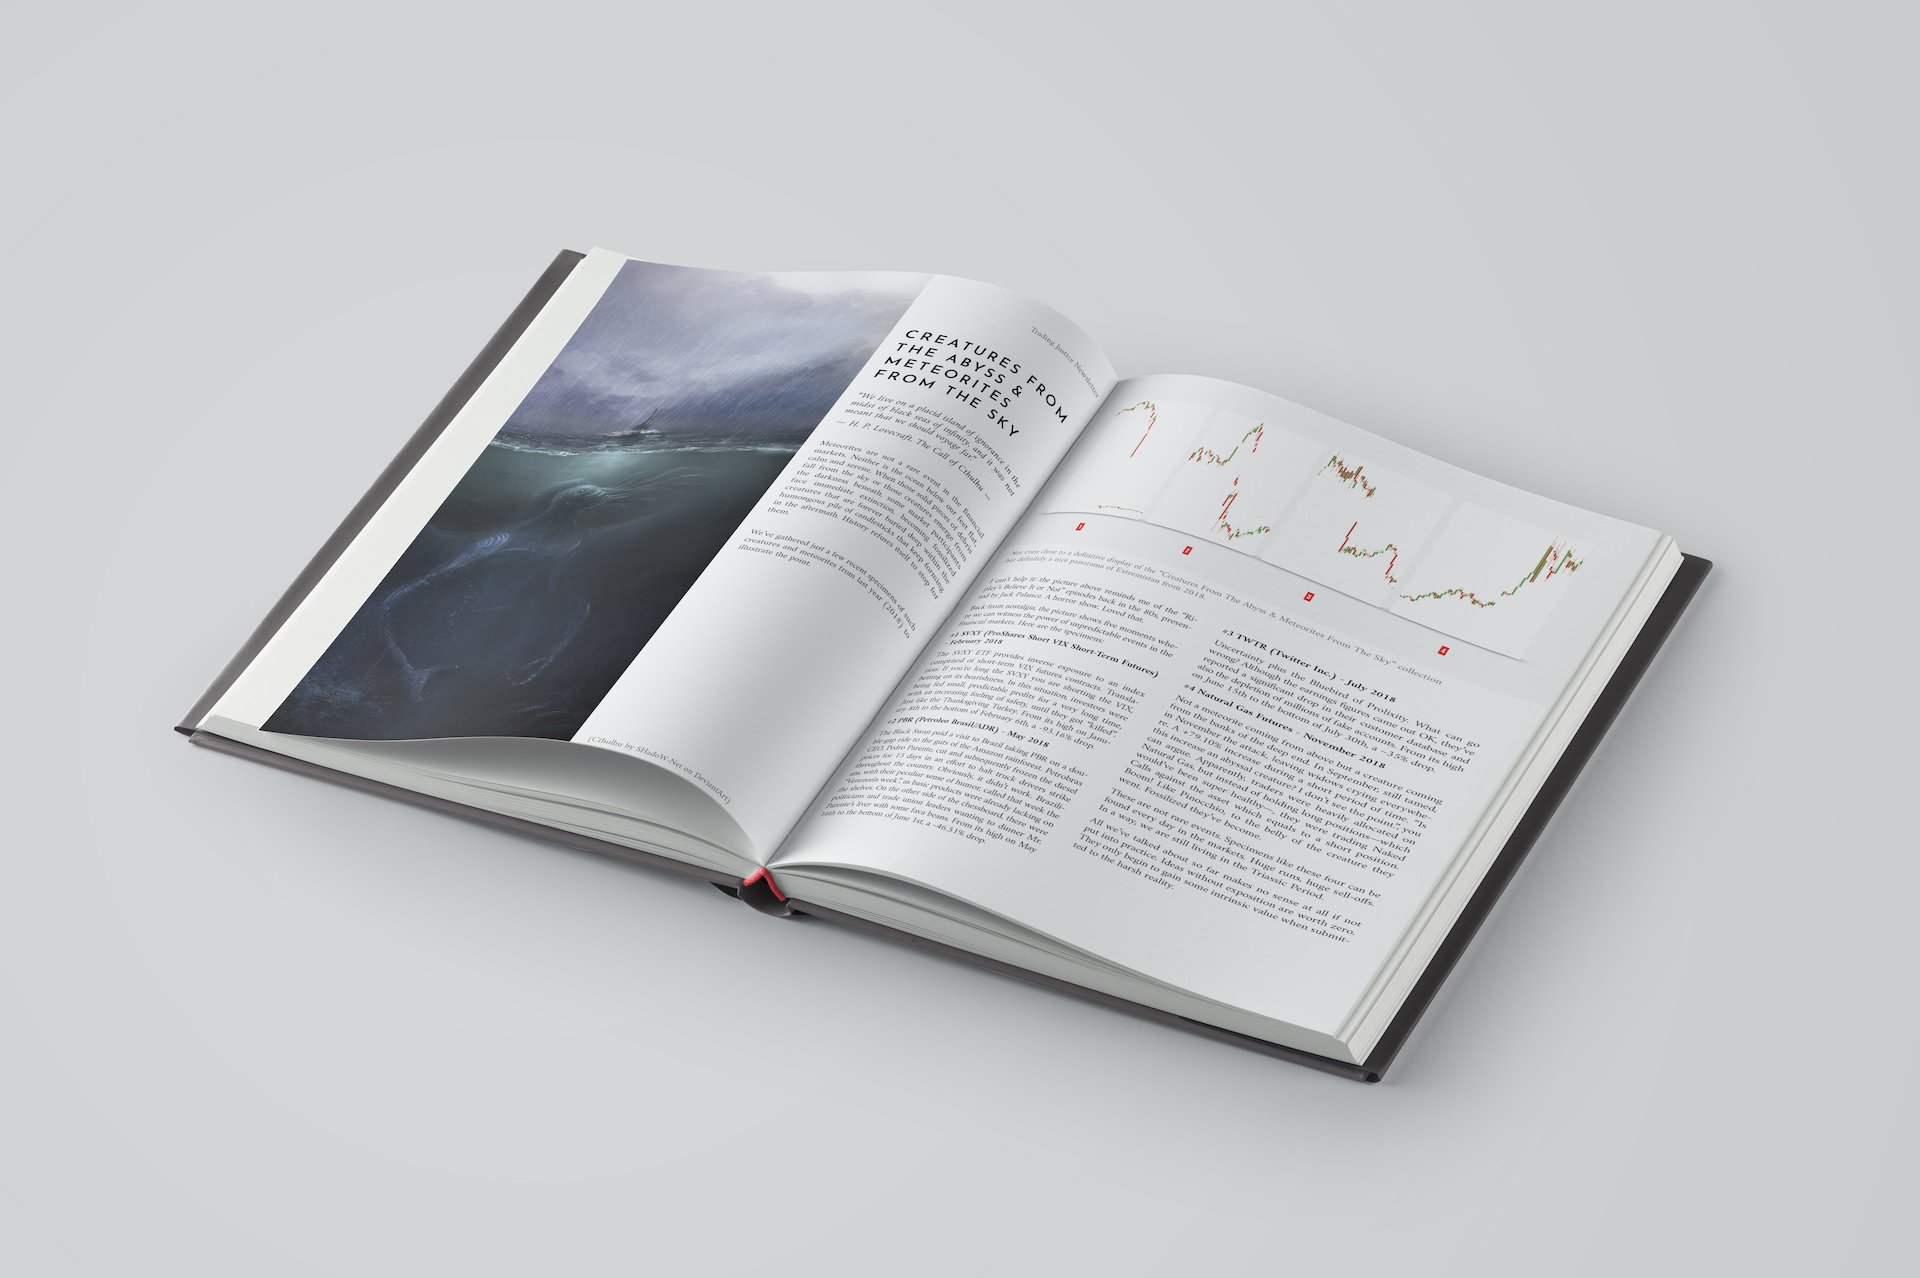
Creatures From The Abyss & Meteorites From The Sky
We live on a placid island of ignorance in the midst of black seas of infinity, and it was not meant that we should voyage far.
— H. P. Lovecraft, The Call of Cthulhu
Meteorites are not a rare event in the financial markets. Neither is the ocean below our feet flat, calm and serene. When those solid pieces of debris fall from the sky or those creatures emerge from the darkness beneath, some market participants face immediate extinction, becoming fossilized creatures that are forever buried deep within the humongous pile of candlesticks that keep forming in the aftermath. History refuses itself to stop for them.
We’ve gathered just a few recent specimens of such creatures and meteorites from last year (2018) to illustrate the point.
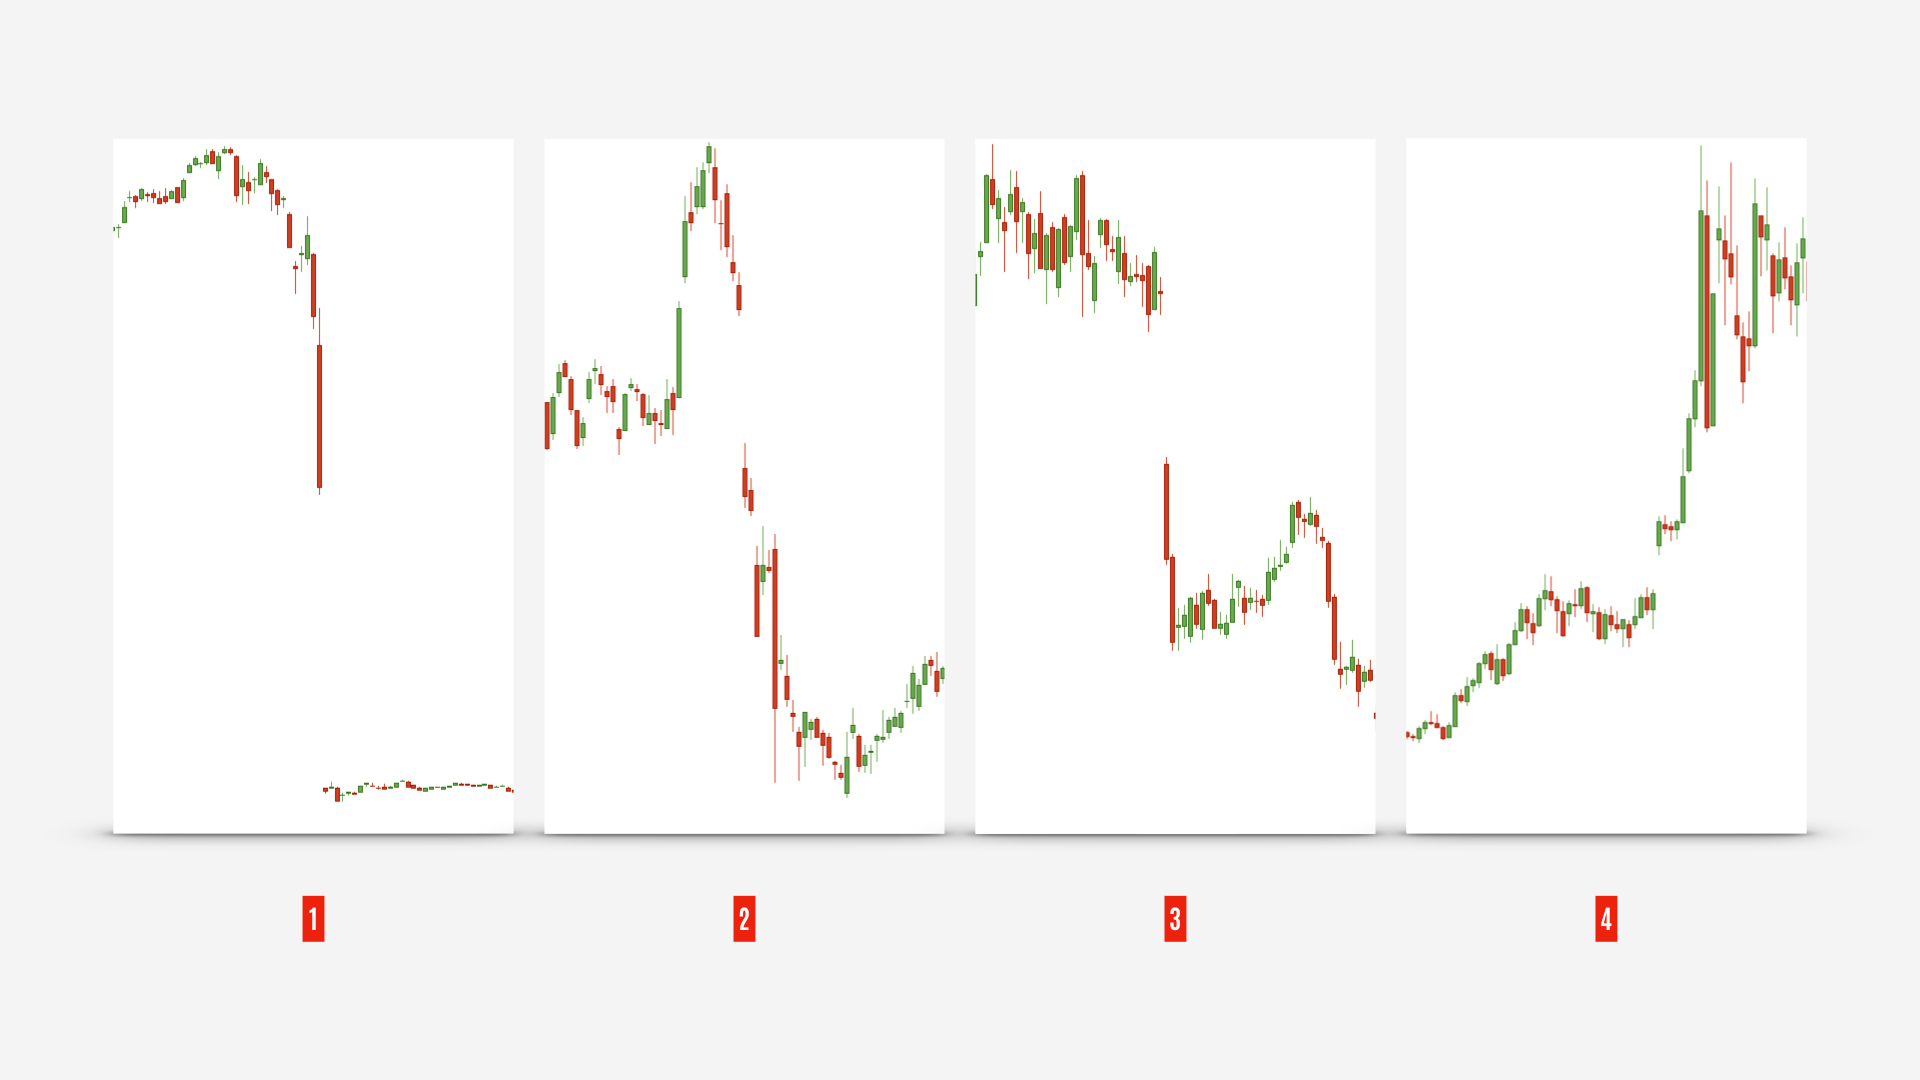
Not even close to a definitive display of the “Creatures From The Abyss & Meteorites From The Sky” collection but definitely a nice panorama of Extremistan from 2018.
I can’t help it: the picture above reminds me of the “Ripley’s Believe It or Not” episodes back in the 80s, presented by Jack Palance. A horror show. Loved that.
Back from nostalgia, the picture shows five moments where we can witness the power of unpredictable events in the financial markets. Here are the specimens:
#1 SVXY (ProShares Short VIX Short-Term Futures) – February 2018
The SVXY ETF provides inverse exposure to an index comprised of short-term VIX futures contracts. Translation: If you’re long the SVXY you are shorting the VIX, betting on its bearishness. In this situation, investors were being fed small, predictable profits for a very long time, with an increasing feeling of safety, until they got “killed”. Just like the Thanksgiving Turkey. From its high on January 8th to the bottom of February 6th, a -93.16% drop.
#2 PBR (Petroleo Brasil/ADR) – May 2018
The Black Swan paid a visit to Brazil taking PBR on a double-gap ride to the guts of the Amazon rainforest. Petrobras CEO, Pedro Parente, cut and subsequently frozen the diesel prices for 15 days in an effort to halt truck drivers strike throughout the country. Obviously, it didn’t work. Brazilians, with their peculiar sense of humor, called that week the “Venezuela week”, as basic products were already lacking on the shelves. On the other side of the chessboard, there were politicians and trade union leaders wanting to dinner Mr. Parente’s liver with some fava beans. From its high on May 16th to the bottom of June 1st, a -46.51% drop.
#3 TWTR (Twitter Inc.) – July 2018
Uncertainty plus the Bluebird of Prolixity. What can go wrong? Although the earnings figures came out OK, they’ve reported a significant drop in their customer database and also the depletion of millions of fake accounts. From its high on June 15th to the bottom of July 30th, a –35% drop.
#4 Natural Gas Futures – November 2018
Not a meteorite coming from above but a creature coming from the banks of the deep end. In September, still tamed, in November the attack, leaving widows crying everywhere. A +79.10% increase during a short period of time. “Is this increase an abyssal creature? I don’t see the point.”, you can argue. Apparently, traders were heavily allocated on Natural Gas, but instead of holding long positions—which would’ve been super healthy—, they were trading Naked Calls against the asset which equals to a short position. Boom! Like Pinocchio, to the belly of the creature they went. Fossilized they’ve become.
These are not rare events. Specimens like these four can be found every day in the markets. Huge runs, huge sell-offs. In a way, we are still living in the Triassic Period.
. . .
All we’ve talked about so far makes no sense at all if not put into practice. Ideas without exposition are worth zero. They only begin to gain some intrinsic value when submitted to the harsh reality.

Getting pragmatic: Position Sizing is path dependent
A few pages back, we’ve said that financial markets are ruled by randomness and extreme events. We like to live inside this idea that we have total control of things but we don’t. We are fooled by the misconception that a low volatility environment is one without risks. We fail to recognize that the financial markets are just like theaters with one small door, millions of people inside and suddenly someone could be screaming FIRE! and we’re done. We can’t accept the fact that the future is opaque so we tend to choose poorly which scenario will actually occur, A or B, without even knowing that both C and D could be happening at the same time. The magnitude of their impact is unknown.
But that doesn’t mean we can’t do anything about it. Some of you would argue that entering only high probability trades will suffice, but that’s not telling the whole story. You can stack the odds in your favor but if you don’t address position sizing first, you’re done.
If you set up a system with 80% probability of winning and 20% of losing and you lose EVERYTHING during the first two rounds, you won’t play the game anymore although, mathematically, you still had EIGHT winning rounds to come. You could’ve won eight times out of ten, but you got killed in the first rounds. Making 1 million and then losing 500k is completely different than begin losing 500k.
With this simple argument, we want to show you that the final outcome of your system depends on the path of the previous outcomes. It is a path dependent process. You can fail, but you must not fail too big for too long. In this case, you’ll be thrown out of the game and this is just what we don’t want to happen. You must continue to play it and make the odds work in your favor.
Watch out your position sizing.

Getting pragmatic: The 1998 Cocoa Breakout Trade
This case study was taken from the book Way of the Turtle, by Curtis Faith. To us, this is a perfect example of how money management can represent the difference between professional traders and adventurous amateurs.
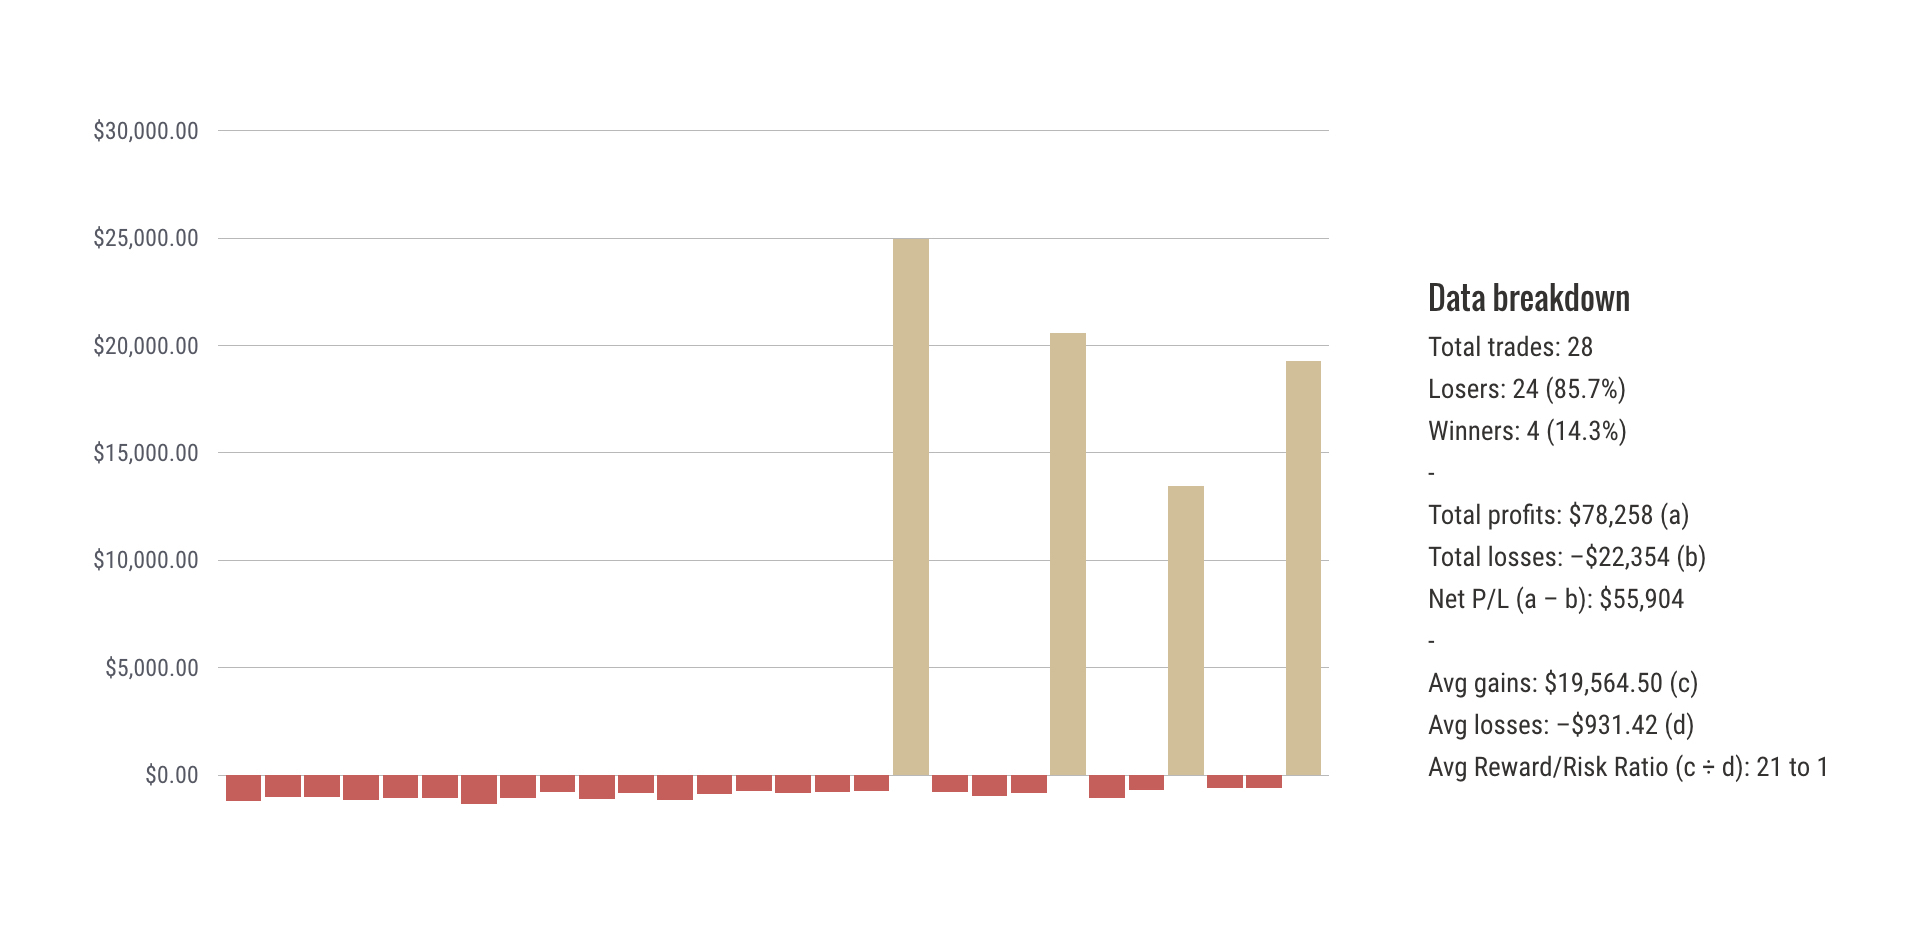
“Table 4-1 shows the cocoa trades one would have encountered by trading breakouts from April 1998 until the trade with the large trend occurred. Note that there are 17 losing trades in a row in the cocoa market before a very sizable winning trade that started in November 1998.” — Original table caption from “Way of the Turtle”, p.51.
A work of art. Curtis entered a total of 28 positions from April 27th, 1998, to February 2nd, 1999. The number of losers is six times the number of winners. However, notice the size of the winners compared to that of the losers; an average of a 21:1 Reward/Risk Ratio (our next edition of the Trading Justice Newsletter).
Although the system returned losing trades (85.7%) more often than winning ones (14.3%), the position sizing here was surgical, averaging ≈$931 per trade.
A masterpiece of Money Management.

Getting pragmatic: Start from the tail
In our System Development 101 video series, we’ve taught our students how to qualify trades before pulling the trigger. What that means is once traders got the list of candidates to trade, they’ll be running some numbers that will lead to a binomial result: they will or they won’t trade the candidates based on the analysis outcome. No middle term. Diligence, consistency, and organization are key at this moment.
In this phase, traders run three batches of numbers to qualify the trade and make the decision. Position Sizing is so important to us at Tackle Trading that it is the first batch of numbers any of our students will have to run, followed by Risk/Reward Ratio.
This infographic took from the training series, represents a reverse engineering process: traders will start to qualify their trades from the point where everything goes terribly wrong, i.e. from the point where the position will move against them and they will lose money. This is what we are calling “Start from the Tail”. Sounds like a hecatomb, I know, but such events do occur more often than we like them to.
Here’s a basic example of Position Sizing starting from the tail.
Note: The numbers used below are just for teaching purposes. They do not represent any investment/allocation suggestion. Be sure to design your trading/investing portfolio together with your mentor.
Say you have a $20,000 trading account. If the market goes absolutely berserk and turns itself into a Mad Max Fury Road movie, how much of the initial $20,000 you are willing to lose?
“Twenty percent”, you think. So let’s start with that: 20% of the total account value will be allocated to your system.
Now, how much are you willing to lose on each position inside the system, as a percentage of the total account value, if every one of them goes absolutely against you?
“One percent loss on each position”, you ponder. So, on each position inside your system, if everything goes wrong, you’re willing to lose 1% of the total account value.
That train of thought is telling you that you must never enter a position that will make you lose more than 1% of the total account value on that particular system and you also must never exceed 20% of account value allocated in the system.
Wrapping up:
- Account value: $20,000
- Max allocation in your system: 20% account value › $4,000
- Max loss on each position inside your system: 1% total account value › $200
- Max number of ongoing trades you can have: 20.
In the worst case scenario, that is, you will exit all trades at the max loss, you will lose 20% of your account. If you were OK with that number in the first place, there is no reason for you to freak out.
That’s Position Sizing/Money Management in a nutshell.
. . .

UV photograph (AS15-99-13488) shot by Apollo 15 Astronaut Al Worden of a crescent Earth seen during the return home from the Moon – Apollo 15 Mission, August 4th, 1971.
The most terrifying fact about the universe is not that it is hostile but that it is indifferent; but if we can come to terms with this indifference and accept the challenges of life within the boundaries of death […] our existence as a species can have genuine meaning and fulfillment. However vast the darkness, we must supply our own light.
— Stanley Kubrick, interviewed by Eric Nordern for Playboy Magazine (September 1968)
How successful traders and investors are born? The first step is mastering Portfolio Design; the second is mastering Position Sizing (a.k.a. Money Management). Above all, Position Sizing is an exercise of humility. We don’t move the markets, we follow them. They are indifferent to us and can be very hostile. They are not simple, but utterly complex. Our decision-making process is very much clouded by this complexity. We don’t know the future. Uncertainty lurks. Fat tail events await. We can torture the numbers whatever we want to make it fit into our own version of the Bed of Procrustes. It will never work. To some extent, we must love the fact that we can only lose –100% and acknowledge that Position Sizing will be there for us when all else fails.
See you in the next edition, where we will be discussing Risk-Reward Ratio (also called Reward to Risk Ratio).

