- The CBOE Put Write Index illustrates how to create a system using naked puts.
- It’s a perfect Index to study if you want to understand the merits of the naked put strategy
- It has generated superior risk-adjusted returns versus owning the S&P 500.
If you want to understand the risk and return characteristics of stock investing, then look at the S&P 500. It’s the premier benchmark for U.S. equities, followed by professionals and retail investors worldwide. For the past century, it’s grown around 10% annually, but the climb has been beset by wicked volatility and treacherous bear markets.
As an index, the S&P 500 provides a picture or snapshot of what you experience when you buy and hold stocks. In other words, the strategy of equity investing can be seen by looking at a chart of the S&P 500. This idea should intrigue those who are learning about options strategies like covered calls, naked puts, collars, condors, and the like.
How do you see what those strategies do over time? You could begin to track it yourself using a trade journal. You can even use backtesting tools and go back in time to see how a particular strategy has performed over time. But that takes loads of time.
Fortunately, there’s a simpler solution. The Chicago Board Options Exchange (CBOE) has created a suite of products known as Strategy Benchmark Indexes. You can find the complete list here. What began as an attempt to reflect the behavior of a simple covered call strategy has grown into a stable of over a dozen indices that track even exotic strategies like butterflies and risk reversals.
This quarter’s newsletter will dig into one in particular – the CBOE PutWrite Index. You’ll learn about the power of naked puts and what it looks like when you systematize the strategy.
Systematize!

There is a difference between a strategy and a system. For example, the following are all strategies: long stock, long calls, short puts, covered calls, iron condors, bull put spreads, and butterflies. They each have a unique structure with different risks and rewards. You can enter any of these strategies on any stock with listed options at any time. But that’s not a system.
Turning a strategy into a system involves building rules, position sizing, and applying consistency.
The Strategy Benchmark indexes like the CBOE PutWrite Index have done just that. They’ve systematized each strategy. They show what happens when you deploy the same strategy in the same way every single month for years on end. Because of the consistent application, they offer a true reflection of what a particular strategy is designed to do. Its inherent pros and cons become obvious as you study the Index.
Put Writing
Before diving into the mechanics of the CBOE PutWrite Index, it’s worth reviewing how a basic put-write works. It’s a strategy that goes by many names, including short puts, naked puts, or just selling puts. When you sell a put option, you get paid a premium for obligating yourself to buy shares of stock. Said another way, you are getting paid for a promise to purchase stock.
For instance, suppose a stock is at $50, and I sell a 50-strike put for $2 premium. Recall that option prices are listed per share, and each contract controls 100 shares. Thus, I’m on the hook to buy 100 shares at $50 but was paid $200 for making the promise. If, at expiration, the put is in-the-money (that is, the stock price is below $50), then I will be required to make good on my obligation to buy the shares at $50. But since I was paid $2 per share, my actual cost basis falls to $48.
This is one of the advantages of selling puts. If assigned, you can buy stock at a discount to its original price. This reduced cost basis makes naked puts a lower-risk alternative to long stock. It also increases your probability of profit. If I bought shares at $50, I would only profit if the stock was above $50. Now, I profit if prices are above $48.
Of course, the twin advantages of a higher probability of profit and lower risk don’t come for free. There is a disadvantage: limited reward.
No matter how high the stock rises, you can only pocket the original premium. That is your max gain. Understanding the pros/cons of the strategy leads to four critical conclusions.
-First, short puts outperform long stock in neutral and bearish markets due to the lower cost basis.
-Second, short puts underperform long stock in strong bullish markets because of the limited reward.
-Third, short puts generate a profit a higher percentage of the time than long stock. They yield more consistent profits.
-Fourth, short puts carry less risk than long stock. Again, this is because of the lower cost basis.
We will revisit these four items when examining the put-write index.
Cash-Settled vs. Stock-Settled

The previous discussion assumed we were using stock-settled options. So, the explanation of the short put turning into long stock at expiration is correct when selling puts on stocks and ETFs. But Index options are different because there are no underlying shares. For instance, you can’t buy shares of SPX, RUT, or NDX. Their contracts are settled in cash.
Here’s how it works.
Let’s say you with the SPX trading at $4,000 you sold the 30-day, at-the-money put for $80. If at expiration SPX is trading above $4,000 then your put would expire worthless and you’d pocket the $80. But let’s say SPX sold off over the next month and settled at $3,700 at expiration. Your $4,000 put would be in the money by $300. But you wouldn’t end up being long 100 shares at $4,000. Shares of SPX don’t even exist! Instead, $300 would be debited from your account. Essentially, you’re giving back the original $80 premium plus $220 of your own money. That $220 would be the loss in the trade.
The cleanliness of cash-settled options makes SPX a great underlier to build a put-selling system on. There’s no risk of early assignment and no need to worry about having to flip back and forth from options to stock if assigned.
With a proper understanding of selling puts and how cash settlement works, we’re now ready to unveil the PutWrite Index.
Meet the PutWrite Index
Here’s the Cboe’s official description of the PutWrite Index:
“The Cboe S&P 500 PutWrite Index tracks the value of a passive investment strategy (“Cboe S&P 500
Collateralized Put Strategy”) which consists of overlaying S&P 500 (SPX) short put options over a
Treasury bills account invested in one-month and three-month Treasury bills. The SPX puts are struck
at-the-money and are sold on a monthly basis, usually on the 3rd Friday of the month.”
Don’t get tripped up by the Treasury bill portion. First, they are selling these puts cash-secured. That means they’re setting aside enough cash to cover the entire risk of each short put. It’s a non-leveraged way to employ the strategy and it ensures the only way to go bankrupt is if SPX drops 100%. Such an outcome would require a meteor hitting the earth or Armageddon. Instead of parking the cash in a low-yielding savings account, they are investing in treasury bills to capture a competitive rate of return. For instance, right now 1-month treasuries are yielding 4.75%. In higher interest rate environments, the T-bill portion of this system will help juice its returns.
Here’s the next portion of the Cboe explainer:
“Under the PUT Index methodology, roll date is the third Friday of each month. Should
the third Friday fall on an exchange holiday, the roll date is the preceding day. The strike price of the new SPX puts that are sold is the strike price of listed SPX puts that is closest to but not greater than the last value of the S&P 500 Index reported before 11:00 a.m. ET. For example, if the last S&P 500 Index value reported before 11:00 a.m. ET is 1233.10 and the closest listed SPX put strike price below 1233.10 is 1230 then 1230 strike SPX puts are sold.”
There are two key takeaways from this portion:
First, because it’s a system they are rolling the puts every month to maintain exposure. And the third Friday of each month is the expiration date. So, the system sells a 30-day put, rides to expiration. Closes it and sells a new 30-day put. Rinse and repeat.
Second, they are selling the first strike below the stock price. Given the plethora of strikes and the minimal increment between them, this is, for all intents and purposes, an at-the-money put.
So how has systematically selling puts with these rules fared over the past thirty-odd years? Read on to find out.
Return Comparisons
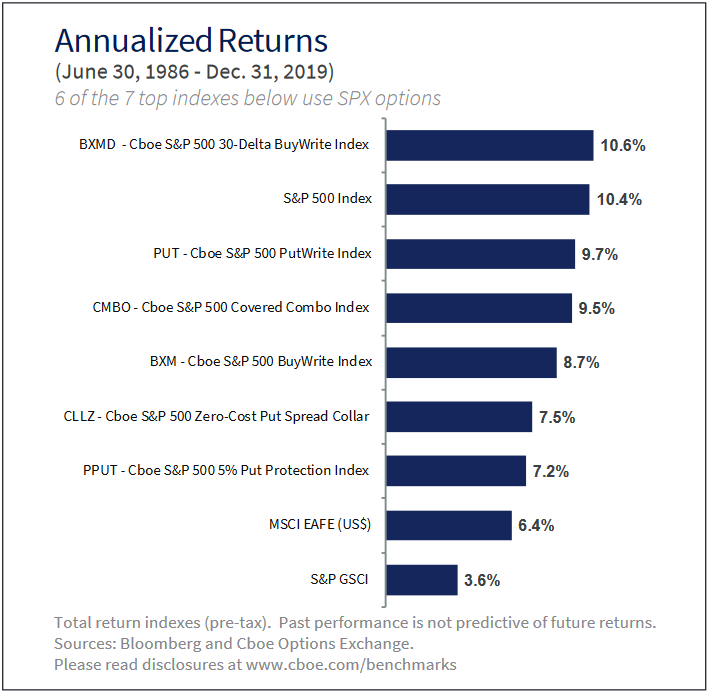
According to the Cboe Options Exchange and Bloomberg, the PUT Index has generated annual returns of 9.7% going back to 1986. It’s not a 25% annualized return but it ain’t chopped liver either. Here’s a table offering a side-by-side comparison of the PutWrite Index versus a handful of other Strategy Benchmark Indexes and traditional indexes.

Here are a few key takeaways.
First, systematically selling puts on the S&P 500 has generated profits over time. Though it’s had its fair share of drawdowns along the way (which we’ll explore more below), it has always recovered. This is one of the most important features of a good system: consistent profits over time.
Second, over the timeframe of the study (1986 – 2019) the Put Write Index actually slightly underperformed the S&P 500, at 9.7% vs. 10.4%. This is due primarily to the fact that U.S. stocks have grown dramatically over the past three decades. As discussed above, short puts will not keep pace with long equity in a strong bull market due to their limited reward nature.
Still, 9.7% vs. 10.4% isn’t all that big of a difference. And when it comes to the risk side of the equation, the Put Write Index is more than redeemed.
A Smoother, Less Risky Path
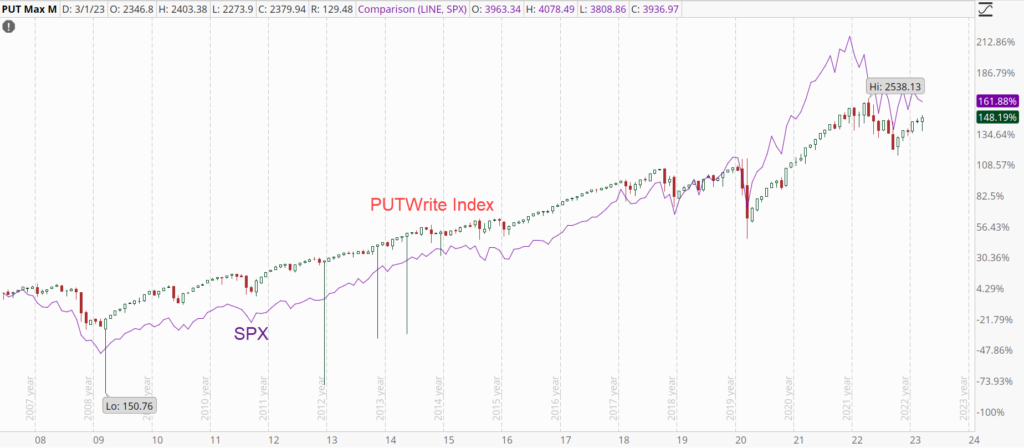
The following three charts tell the tale. We begin with the price performance of PUT vs. SPX going back to 2007. PUT is charted using candlesticks and SPX is the purple line.

PUT fell far less than SPX during the 2008 crisis, showing that short puts trump long stock in a bear market. And then, many of the years between 2007 and 2020 saw a gradual rise in the market where short puts were able to keep pace with long equity. It wasn’t until after the pandemic when the market went vertical that SPX finally bested PUT. Once again, the limited reward nature of short puts loses ground in a strong bull market.
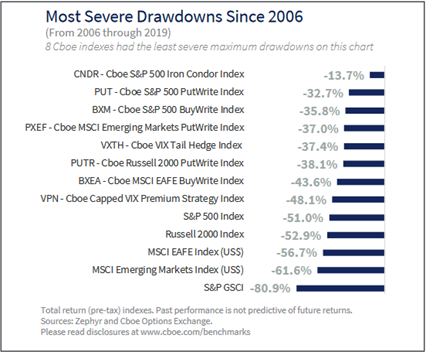
The next chart compares the largest drawdowns (aka peak to trough declines) in variety of Indexes including PUT and SPX.

Notice how the S&P 500 tumbled 51%. It doesn’t specify, but this was undoubtedly the 2008 crash. By comparison, PUT only declined 32.7%. That’s quite the performance gap in a nasty bear market.
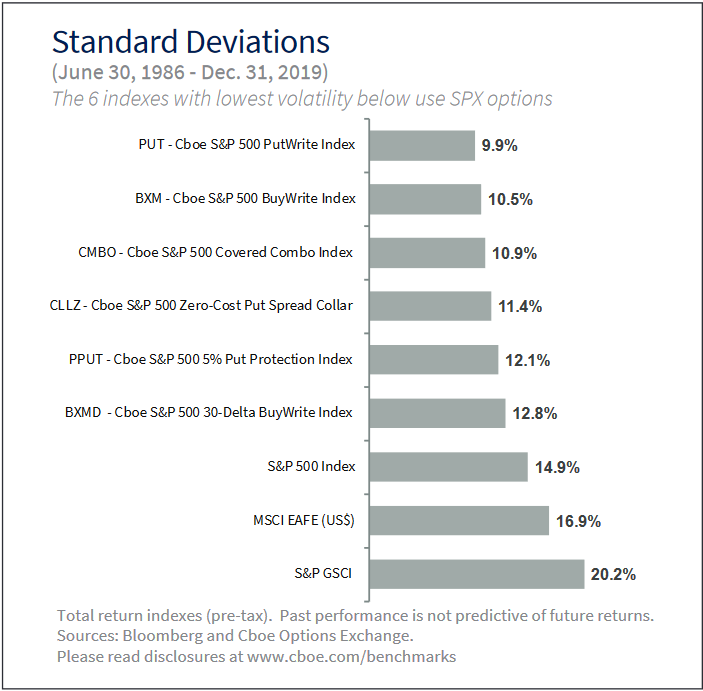
The final graphic looks at the standard deviation of the same indexes we viewed above in the Annualize Return chart. Standard Deviation is a mathematical way to measure volatility and it is Wall Street’s go-to metric for looking at the risk side of the equation. This is intuitive, but the lower the standard deviation the better.

We’ve referenced the lower-risk nature of short puts already. And here’s the proof. At 9.9%, the PutWrite Index has one-third less volatility than the S&P 500. Think about that for a minute. Day to day, month to month, year to year, someone mimicking the PutWrite index by selling monthly SPX puts has seen 33% less fluctuation in their portfolio versus owning equity.
That’s significant and it brings us to the final point of this quarter’s newsletter.
The CBOE PutWrite Index has generated similar returns to the S&P 500 but with one-third less volatility. That’s what professionals call superior risk-adjusted returns.
If you’re intrigued by the merits of put selling and want to see the strategy in action, come join the Team Phoenix Trading Lab where Coach Tyler Craig teaches and tracks a cash flow system designed around short puts.
Legal Disclaimer
Trading Justice LLC (“Trading Justice”) is providing this website and any related materials, including newsletters, blog posts, videos, social media postings and any other communications (collectively, the “Materials”) on an “as-is” basis. This means that although Trading Justice strives to make the information accurate, thorough and current, neither Trading Justice nor the author(s) of the Materials or the moderators guarantee or warrant the Materials or accept liability for any damage, loss or expense arising from the use of the Materials, whether based in tort, contract, or otherwise. Tackle Trading is providing the Materials for educational purposes only. We are not providing legal, accounting, or financial advisory services, and this is not a solicitation or recommendation to buy or sell any stocks, options, or other financial instruments or investments. Examples that address specific assets, stocks, options or other financial instrument transactions are for illustrative purposes only and are not intended to represent specific trades or transactions that we have conducted. In fact, for the purpose of illustration, we may use examples that are different from or contrary to transactions we have conducted or positions we hold. Furthermore, this website and any information or training herein are not intended as a solicitation for any future relationship, business or otherwise, between the users and the moderators. No express or implied warranties are being made with respect to these services and products. By using the Materials, each user agrees to indemnify and hold Trading Justice harmless from all losses, expenses, and costs, including reasonable attorneys’ fees, arising out of or resulting from user’s use of the Materials. In no event shall Tackle Trading or the author(s) or moderators be liable for any direct, special, consequential or incidental damages arising out of or related to the Materials. If this limitation on damages is not enforceable in some states, the total amount of Trading Justice’s liability to the user or others shall not exceed the amount paid by the user for such Materials.
All investing and trading in the securities market involve a high degree of risk. Any decisions to place trades in the financial markets, including trading in stocks, options or other financial instruments, is a personal decision that should only be made after conducting thorough independent research, including a personal risk and financial assessment, and prior consultation with the user’s investment, legal, tax, and accounting advisers, to determine whether such trading or investment is appropriate for that user.
