
Stocks just completed their worst start to a year since 2009. The S&P 500 Index finished January down 5.3% after staging a sharp two-day rally at the end of the month. Without that, the large-cap benchmark would have been down over 9%!
It was a rude entrance for 2022, particularly after 2021 treated investors so well. The S&P 500 ballooned 27% over the previous 12-month period with extremely little volatility. The maximum peak to trough drawdown was a mere -5%. Comparatively, the past four weeks seem like a roller coaster from Hell.
But bearish episodes are nothing new. They’ve interrupted the upward climb of equities since the dawn of modern markets. They are a feature, not a bug. That means they’re unavoidable and will accompany you along your investing journey. Rather than fearing them or deluding yourself into thinking you can dodge every one, we suggest a more practical approach. Take time to learn about them. Then, make a plan that allows you to survive and even use bear markets to your advantage.
That’s what this month’s newsletter is all about. It is the first in a two-part series that addresses what bear markets are, why they exist, and how you can survive them.
What is a Bear Market?
A bear market occurs when stock prices fall 20% from their peak. Importantly, we’re not talking about a single stock slipping 20%. Instead, we’re referring to when a broad-based index like the S&P 500, Russell 2000, or Nasdaq does so. It signals winter has arrived for the entire asset class of equities.
The other common terms around downturns are a “correction” and a “crash.” The former refers to stocks falling 10% from a high. The latter occurs when equities drop 30%. Thus, declines grow in severity from correction to bear market to crash.
Not all bear markets are created equal. Some are shallow and short-lived. They’re still dangerous and pack a punch, but their brevity makes them easier to handle. Here are some characteristics of what we might call Teddy Bears:
- One index slips 20%, the others fall less.
- The economy doesn’t suffer a recession.
- Corporate profits stagnate or fall slightly.
- Stocks quickly find a bottom after falling 20%.
Believe it or not, some might call the swoon that greeted investors this year a Teddy Bear. Though the S&P 500 only fell 9% from peak to trough and the Nasdaq slipped 18%, the Russell 2000 eclipsed the 20% threshold. So far, the small-cap benchmark has fallen 23% from tip to tip.
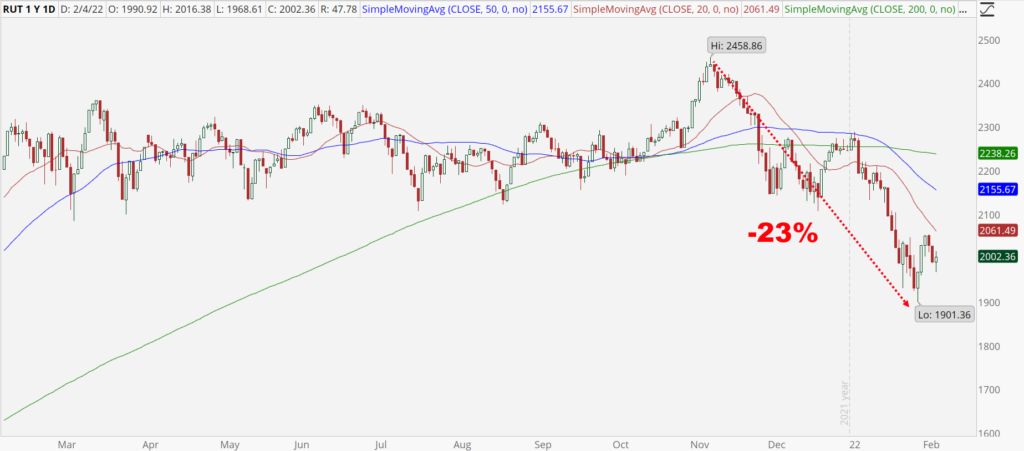
But the damage gets worse. The S&P 500 is market-cap weighted, which means its performance is heavily influenced by the biggest companies like Apple, Alphabet, Amazon, and Microsoft. Their behemoth balance sheets have allowed them to weather the storm quite well. If you look underneath the surface there are legions of stocks that have dropped 50%. The ARKK Innovation ETF is a perfect example.
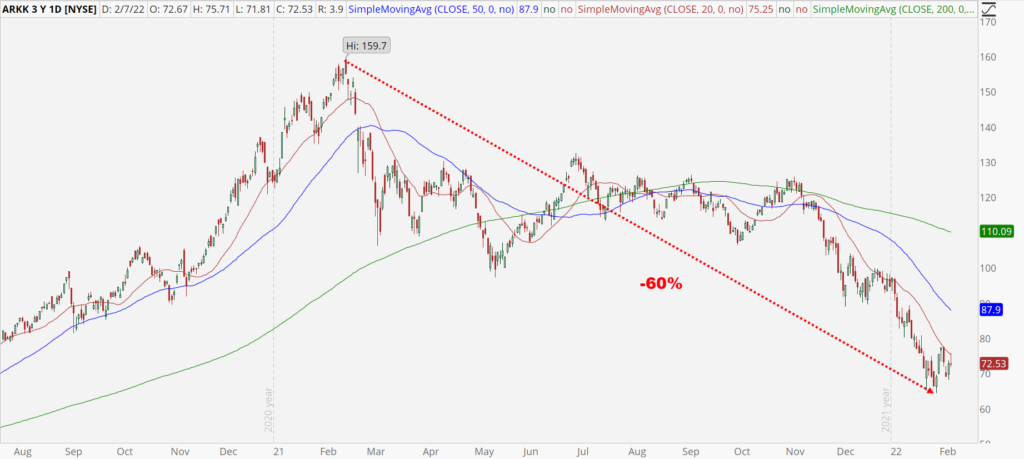
Teddy bear for the major indexes. Something far more ominous for those that don’t hold the mega-cap status.
And then there are the more vicious bears. They are straight-up killers. After reviewing the above, you can probably guess their characteristics, but here they are.
- All major indexes fall 20%+.
- The economy tumbles into a recession.
- Corporate profits contract significantly
- Stocks fall as much as 30% to 50% or more.
- It takes multiple quarters or even years before stocks finally exit bear country.
Fortunately, the more severe bears are rare. The last three came in 2000, 2008, and 2020.
Now, here are three things to keep in mind about these downturns:
First, there’s nothing magical about using “-20%” as the definition. Why wasn’t -18% or -22% picked as the line in the sand? I don’t know. But I think it’s as good a threshold as any. Anything significantly shallower than that would have resulted in calling every minor stumble along the way a bear market. And if we waited until stocks fell 40% to call it a bear market, we’d have less than one every few decades to identify. Thus, I think 20% is as good as any number for labeling bull versus bear.
Second, just because the market dropped 20% doesn’t mean it has to stay there. I’ve seen many markets leave the bear zone within days of entering it. Calling something a “bear market” says much about what has happened but little about what will happen.
Third, because the 20% threshold is arbitrary, most active traders use the market trend to differentiate between bulls and bears. This is a more timely way to determine your bias than waiting for equities to crumble 20%. For instance, if the S&P 500 falls 5% from its peak and cracks significant support and the 50-day moving average – many traders would turn bearish.
Bear Market Frequency
Now that we understand what a bear market is, here’s some context for how often they occur. The numbers vary slightly depending on whether you use the S&P 500 or another Index. Because of the higher volatility, the Nasdaq and Russell 2000 both have more frequent bear markets than the S&P 500.
The source for the following stats is A Wealth of Common Sense.
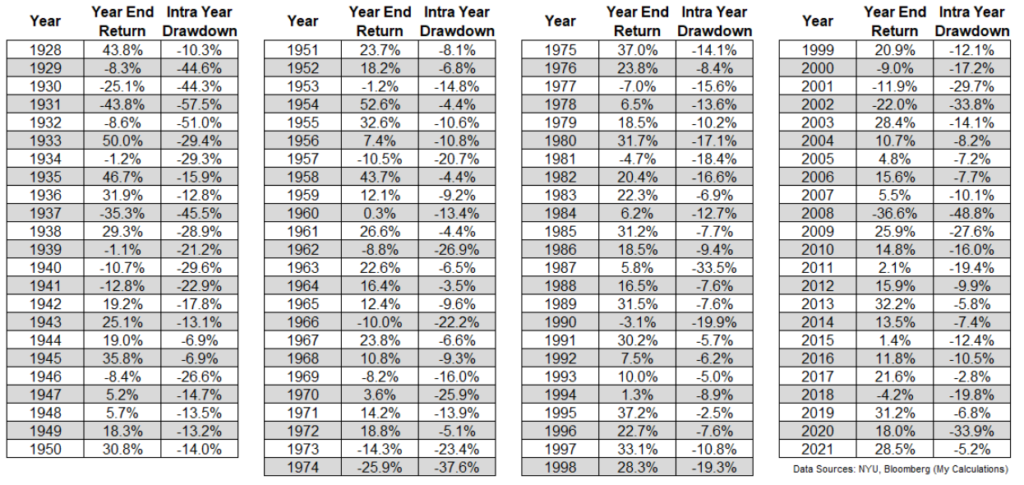
Going back to 1950, the average annual decline for the S&P 500 is 13.6%. Along the way, we’ve experienced 36 corrections, 10 bear markets, and 6 crashes. Here’s what the average occurrence works out to:
- a correction (-10%) every 2 years
- a bear market (-20%) every 7 years
- a crash (-30%) every 12 years
If you want to go down the rabbit hole, I’ve included every year of data for the S&P 500 back to 1928 below. You’ll discover volatility is an integral part of the stock market. What I find the most impressive is the number of years that suffered corrections but still ended positive. The lesson from history is clear. The advance is permanent, and the declines, however scary, are temporary.
Okay. Bear markets exist. But why?
Why Do Bear Markets Exist?
Many models have been created to explain what drives stock prices. Some are helpful; others are garbage. The simplest explanation involves corporate profits.
Corporate Profits
A popular synonym for “stocks” is “equities.” The term reminds you that you’re buying equity or ownership in a company. As the company’s profits or earnings grow, so too should the value of your equity. In the long run, as goes corporate profits, so goes the stock market. Consider how this has played out over the past 32 years.
In 1990 the S&P 500 ended at $330. Today it’s around $4,650, up 14 times.
In 1990 the S&P 500 earnings per share was $22.65. Forecasts for 2022 are running past $220, up nearly 10 times.
Here’s a more recent visual tracking of the relationship between the two. The light blue line depicts the price of the S&P 500. The smoother, dark blue line tracks the Index’s earnings per share (EPS).
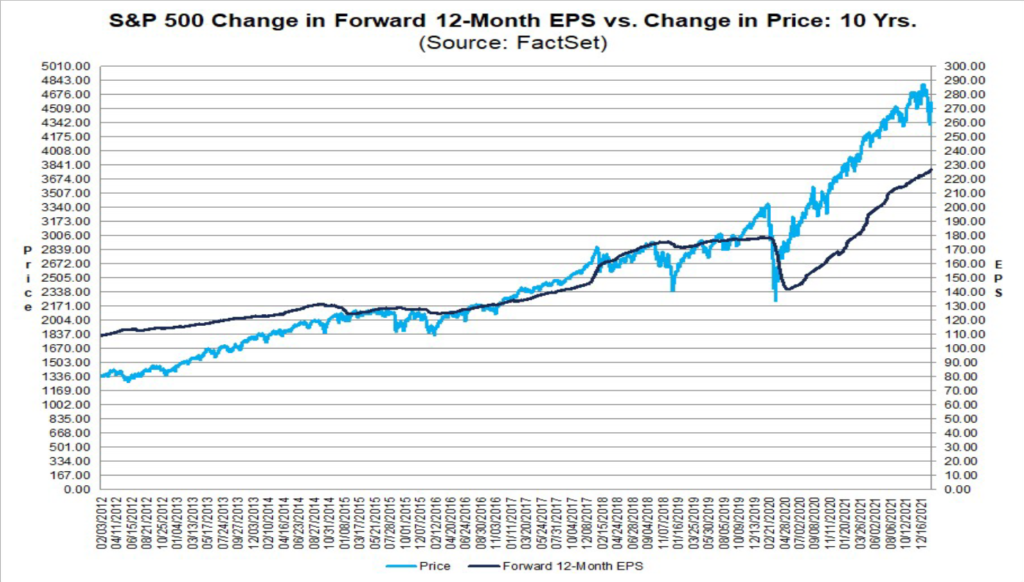
It makes sense that the more vicious bear markets occur when the economy tips into a recession because economic contractions kill corporate profits. Markets are resilient and can look past a lot of temporary drama. But take away profits, even reduce them by 10%, and stocks get clobbered.
Of course, corporate profits have never stayed down. Eventually, whatever impeded company earnings (war, natural disaster, inflation, political instability, monetary policy mishaps, or a pandemic) goes away. The economy heals itself, and consumers go back to buying goods and services. Profits recover, and voila! So too do stock prices.
In addition to earnings, there are two other vital metrics impacting stock prices that could usher in a bear market: interest rates and sentiment.
Interest Rates
Interest rates drive the cost of money and the value of future profits. The first concept is simple—the second slightly more complex.
Think of interest rates as the rent paid by those borrowing money. If rates are low, the rent is cheap, and if rates are high, the rent is expensive. Affordable rent makes it easier to fund expansion, try new ideas, pay workers, and ultimately grow business. Expensive rent makes it harder to do. Projects that were profitable when rates are 1% may become unprofitable at 4%. In sum, low interest rates help profits; high interest rates hurt them.
Interest rates also impact the value of future profits. This is best understood by taking rates to extremes. When rates are zero, there is no risk-free return available. Thus, whether I give you $1 million today or $1 million in a year, it has the same potential value. But, let’s say rates jump to 10%. $1 million today could generate $100k over the next year without taking any risk. Thus, it is worth far more than $1 million in a year. Think of the implications with corporate profits.
High-growth companies are expected to have far more earnings in five years than today. How much are those future profits worth? In a world of zero interest rates – A LOT. But, suppose you start to increase rates. For each quarter-point rise, the value of those future profits becomes incrementally less. And if the Federal Reserve is talking tough about fighting inflation by ending quantitative easing, reducing their balance sheet, and hiking rates multiple times this year, you can start to see why high growth stocks would be so spooked.
If the monetary magicians at the Fed lift interest rates too far, it can slow economic growth and derail corporate profits.
If you want more insight on interest rates, check out our April 2021 Newsletter: A Beginner’s Guide to Interest Rates.
Sentiment
Sentiment is the most complex variable to forecast because humans are emotional creatures. How do you distill fickle feelings down to a single number to plug into a spreadsheet? Even if you knew what corporate profits and the future path of interest rates would be, you still don’t know how investors would feel about it. This comes down to what multiple they’re willing to pay for each dollar of earnings.
The valuation metric traders use to track sentiment is the price to earnings or P/E ratio. Here’s a quick rundown. If a company’s earnings per share is $10 and the stock is priced at $200, we say it’s trading with a 20 multiple. That is, its P/E ratio is 20.
Why are investors willing to pay 20 times earnings for this company? Because that’s how they feel!
When optimism rules the day and investors are oozing confidence about the state of the world, multiples expand. Said another way, they are willing to pay more for each dollar of earnings. As they do so, it pushes stock valuations to rich, and sometimes unsustainable, levels.
When pessimism takes hold and investor confidence wanes, multiples contract. The masses lower how much they’re willing to pay for each dollar of earnings. Valuations cheapen.
Valuations typically don’t remain low or high forever. Eventually, something disrupts the status quo, and P/E ratios revert to (and usually through) the mean.
Here’s a chart of the S&P 500’s P/E ratio for the past decade.
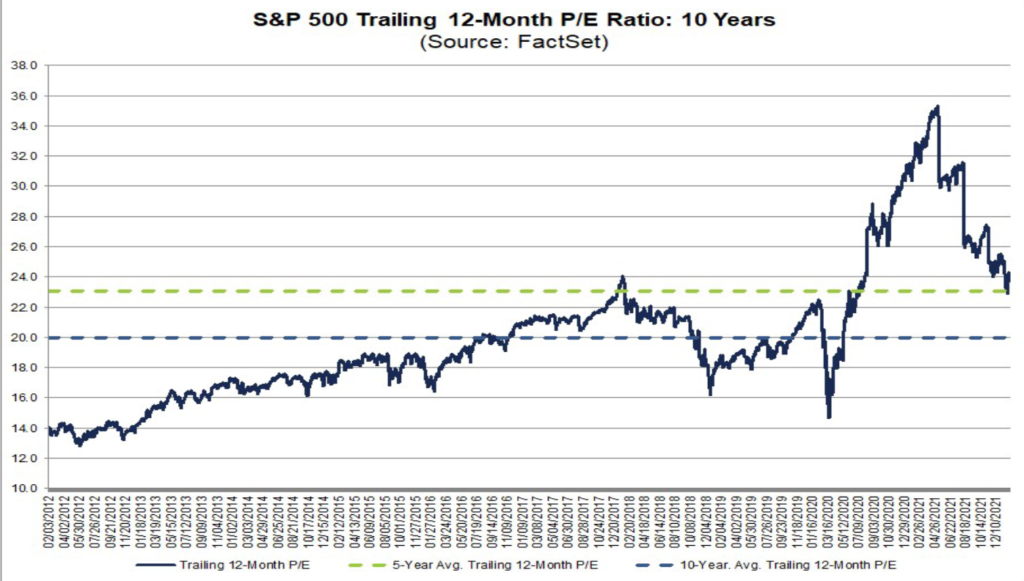
Skyrocketing stock prices after the pandemic jammed the P/E ratio based on trailing 12-month earnings to 35. Fortunately, the subsequent boom in corporate profits allowed earnings to play catch up, and the P/E ratio quickly fell back to its current perch of 23.
All Together Now
Instead of asking what causes a bear market, we might ask it another way. What kills a bull market?
Falling corporate profits is the usual murder weapon. But rising interest rates and declining sentiment are often accessories to the crime.
If you’re curious what’s driving the current bearish episode plaguing stocks, I would say it’s the following. Investors are responding to higher interest rates by repricing asset values. Whether or not this turns into a long-lasting bear market will depend on corporate profits. If they hold firm, this will be a short-lived correction that shrinks valuations to a more sustainable level but doesn’t completely upset the apple cart. On the other hand, if the economy is unable to handle higher interest rates or if the Fed jacks them too high, we could see profits recede, and a more prolonged winter will descend on stocks.
With a proper understanding of what bear markets are and why they exist, you’re now prepared for the final piece – how you can survive them. Rather than condense such a vital topic (we’re running long already), we will save it for next month’s newsletter.
Legal Disclaimer
Trading Justice LLC (“Trading Justice”) is providing this website and any related materials, including newsletters, blog posts, videos, social media postings and any other communications (collectively, the “Materials”) on an “as-is” basis. This means that although Trading Justice strives to make the information accurate, thorough and current, neither Trading Justice nor the author(s) of the Materials or the moderators guarantee or warrant the Materials or accept liability for any damage, loss or expense arising from the use of the Materials, whether based in tort, contract, or otherwise. Tackle Trading is providing the Materials for educational purposes only. We are not providing legal, accounting, or financial advisory services, and this is not a solicitation or recommendation to buy or sell any stocks, options, or other financial instruments or investments. Examples that address specific assets, stocks, options or other financial instrument transactions are for illustrative purposes only and are not intended to represent specific trades or transactions that we have conducted. In fact, for the purpose of illustration, we may use examples that are different from or contrary to transactions we have conducted or positions we hold. Furthermore, this website and any information or training herein are not intended as a solicitation for any future relationship, business or otherwise, between the users and the moderators. No express or implied warranties are being made with respect to these services and products. By using the Materials, each user agrees to indemnify and hold Trading Justice harmless from all losses, expenses, and costs, including reasonable attorneys’ fees, arising out of or resulting from user’s use of the Materials. In no event shall Tackle Trading or the author(s) or moderators be liable for any direct, special, consequential or incidental damages arising out of or related to the Materials. If this limitation on damages is not enforceable in some states, the total amount of Trading Justice’s liability to the user or others shall not exceed the amount paid by the user for such Materials.
All investing and trading in the securities market involve a high degree of risk. Any decisions to place trades in the financial markets, including trading in stocks, options or other financial instruments, is a personal decision that should only be made after conducting thorough independent research, including a personal risk and financial assessment, and prior consultation with the user’s investment, legal, tax, and accounting advisers, to determine whether such trading or investment is appropriate for that user.
