


The stock market is full of clever axioms. Some of the market axioms have a lot of truth to them that when applied correctly, can greatly improve your trading. For example, a few of these axioms include:
- Never try and catch a falling knife
- Ride your winners, cut your losses
- The trend is your friend
When you apply the right set of trading rules to these statements, I firmly believe you will become a better trader. These statements go to the heart of technical analysis and trade management and as such will help you determine exit points, entry points and help you make good decisions along the way.
However, the stock market is also full of many statements and beliefs that are widely accepted that do not involve the principles of technical analysis and proper trade management at all. These statements have caught on perhaps due to a degree or modicum of truth associated with them or perhaps simply because they are catchy and clever. We will look at a very timely and popular one in this month’s Trading Justice newsletter, “Sell in May and Go Away.”
While these sayings and ideas can make for fun dialogue and may even produce a few interesting results, if any trader uses these as a foundational guide to their trading then we need to have a long chat.

Sell in May and Go Away
Sell in May and go away is an expression used by investors who believe stock prices will decline between May and October. These investors subscribe to seasonality or calendar theories and thus look to exit the market during this period and look to move back into the market in November. This is an extremely popular stock market axiom and every year around May 1st you will see the financial mainstream media blast articles and stories about this popular saying.
One of the reasons the saying is so popular is that there is a fair amount of statistical truth to it. When you look at the all-time history of the markets the markets DO historically perform better in November through April when compared to May through October. However, that does not mean that those that invest in markets lose money from May through October, the overall returns are simply lower compared to the November through April cycle. However, this difference, as we are about to see, has been slight in recent years.
For this newsletter, I am going to examine the time period from the Great Recession. I do this not because this ten-year block is a nice ten-year round number, not because it will save me tons of research time. I am a nerd, I like research. I conduct almost all my studies since the great depression in all my trading because that is when the monetary policy of the Federal Reserve arguably changed and as a result price action in the markets. That is a subject for an entire future newsletter. One could also argue that studies should take place since companies started setting records for buybacks but now I really regress.
May to October 2009
- April Closing Price 872.51
 - October Closing Price 1036.19

Those that sold in May and went away in 2009 missed out on strong price appreciation during this time period. Moreover, this first case study provides what is the key point of this entire newsletter. In late July of 2009, the S&P 500 broke out of a clear resistance area (as signified by the red horizontal line on the chart). Those traders that adhere to the basic principles of technical analysis recognize that breakouts out of resistance are strong bullish signals and have many directional strategies to take advantage of these signals.
Not only was there a clear breakout signal with confirmation but there were also several bullish pullback opportunities in the following months.
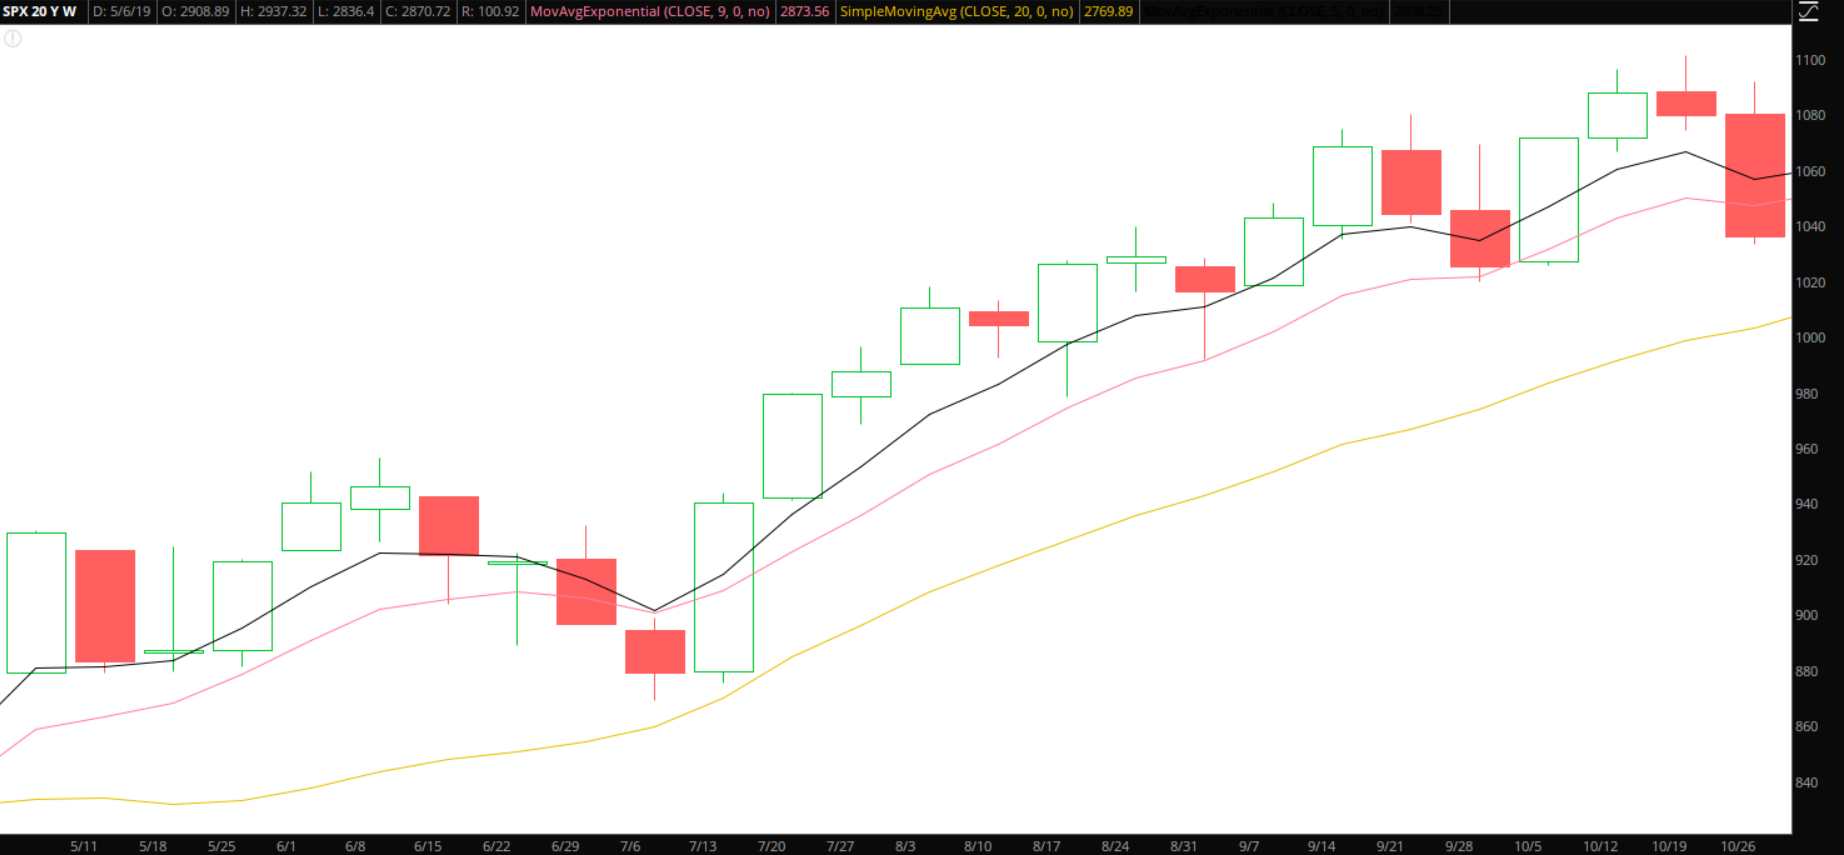
Think about the mindset of two types of traders/investors here. The individual who maintains a bearish posture based on the “sell in May and go away” axiom loses out on the opportunities or worse yet, is placing bearish trades. The trader who is basing their decisions on trading signals can take advantage of these opportunities based on these strong signals. Seems like a no brainer, right? Price stayed above short-term weekly moving averages the entire time period creating many nice pullback opportunities along the way.
However, it never ceases to amaze me the number of individuals who adhere to dogma over technical analysis. It is not theoretical; I have met many of these people. I have literally had multiple conversations with people (one recently that I will detail at the end of the newsletter) who no matter what the signals are saying, have argued that you don’t go bullish during these months based on seasonality arguments of “sell in May and go away.” Don’t be one of these people. A strong trading signal is a strong trading signal whether it is produced in January, July, or September. Plus, it will save my head from banging it against the wall after the conversation.
May to October 2010
- April Closing Price 1186.32
- October Closing Price 1183.26
See, see, see! “Sell in May and Go Away” enthusiasts were undoubtedly patting themselves on the back as the major markets essentially finished October where they ended in April. Still, traders once again who identified a key resistance level and played the breakout were able to take advantage of the nice bullish rally to end this time period.
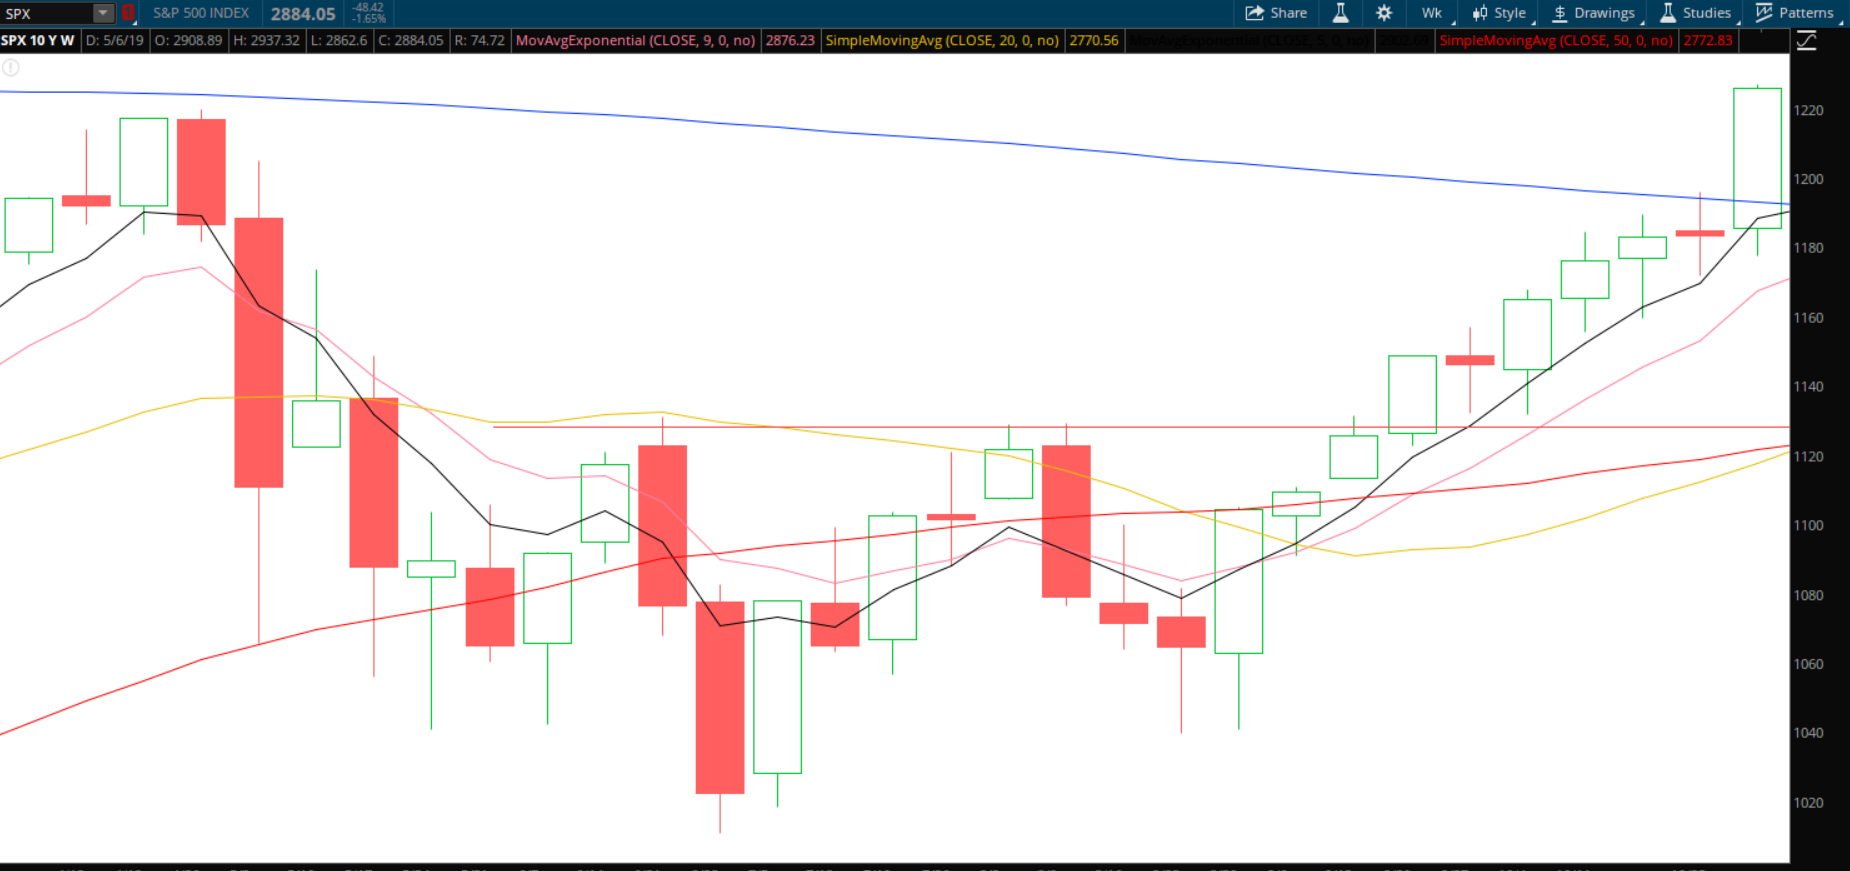
While those that follow the May axiom were glum with their cleverness, those that adhere to technical analysis knew that as April came to a close there was a major technical barrier in front of it (the 200-weekly moving average as shown by the blue line on the chart above). There is not often a lot of action at the 200-weekly moving average but when there is it is significant. As price approached the 200-weekly, was it traders wary of this major technical barrier combined with news that occurred creating volatility or was it the Sell in May blues in effect? I will let you decide but I certainly know where I stand on this issue.
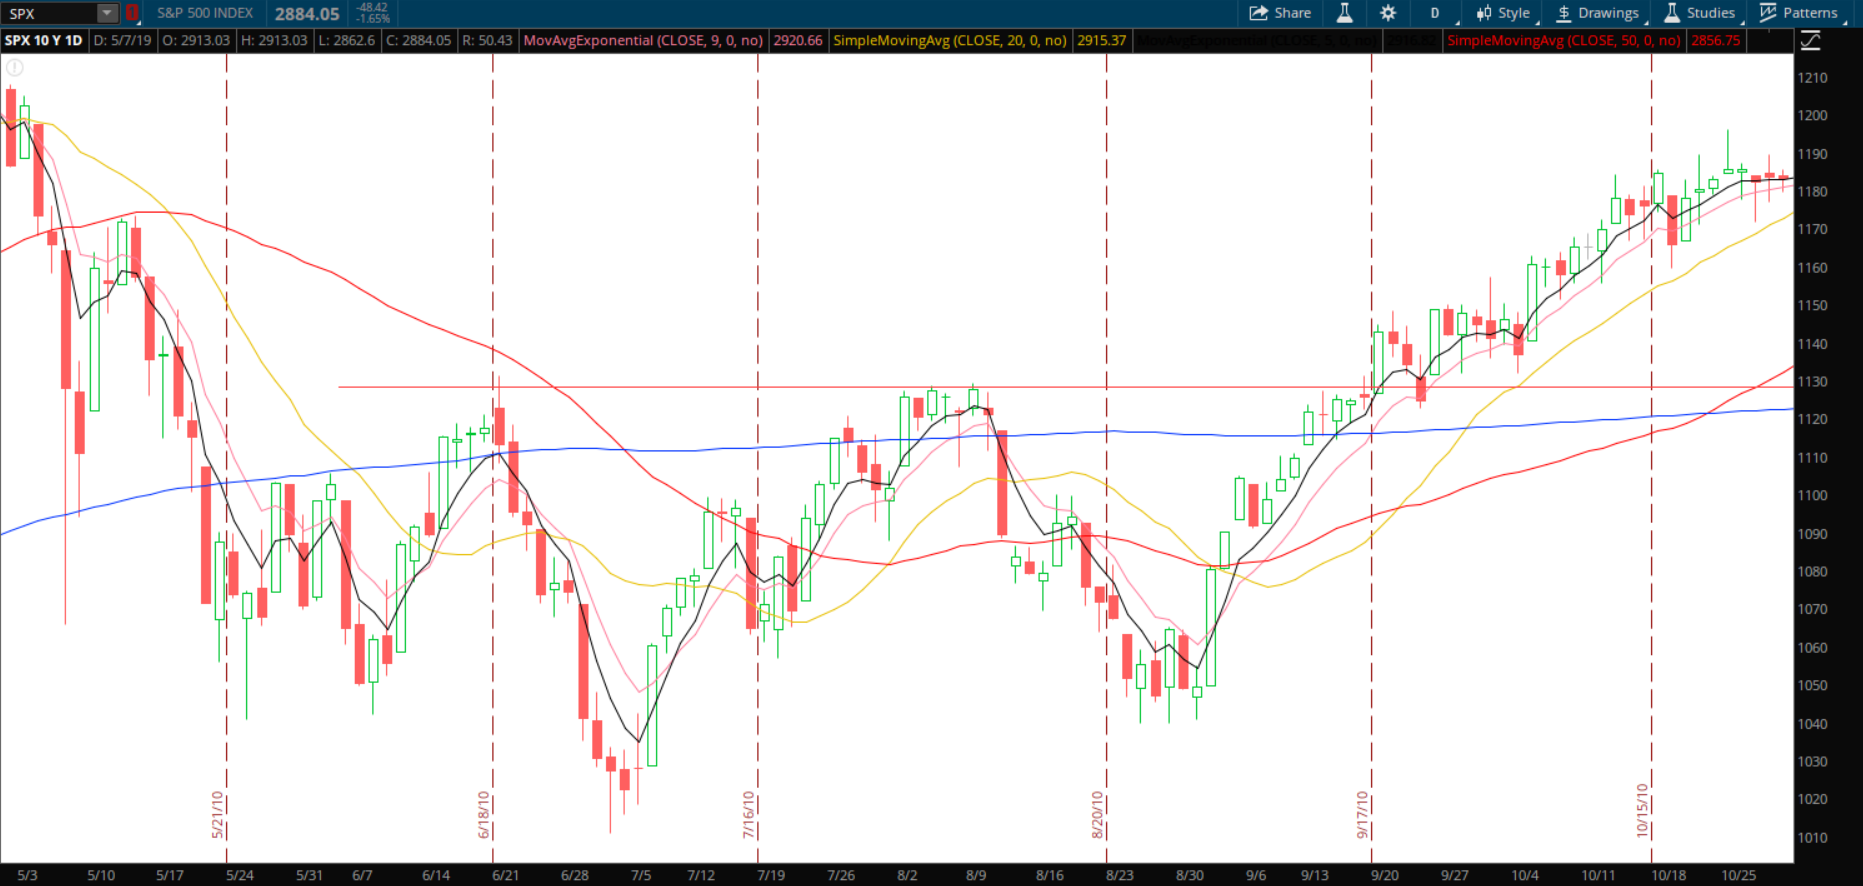
May to October 2011
- April Closing Price 1363.61
- October Closing Price 1253.30
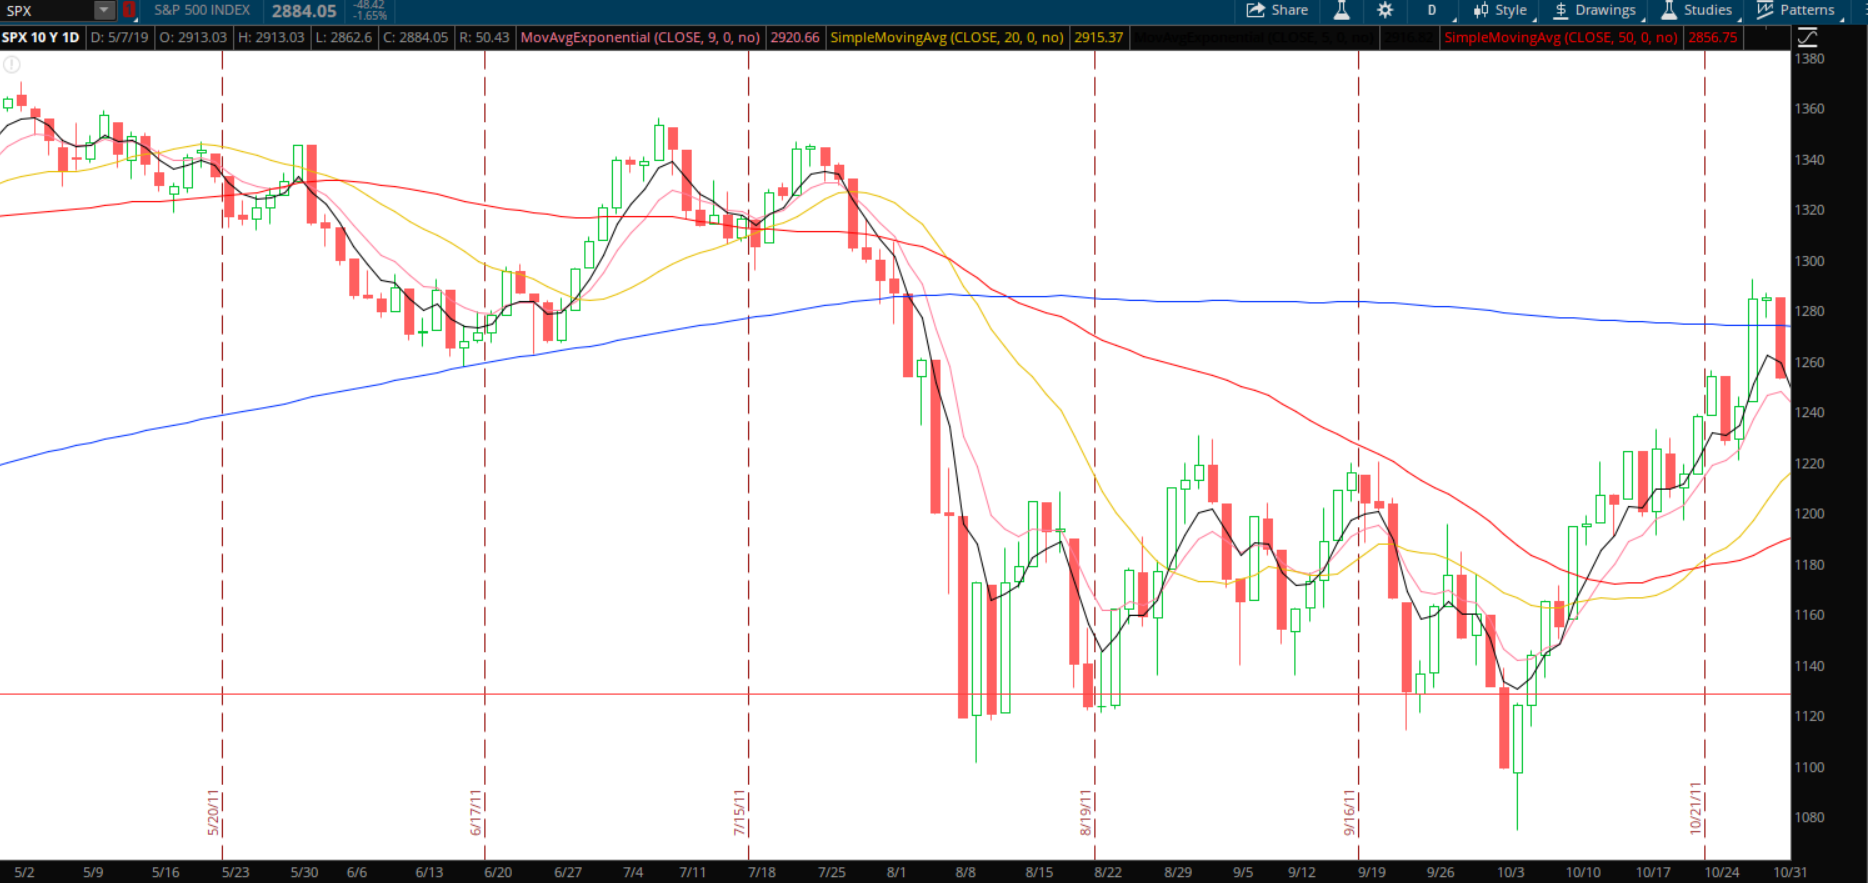
The “Sell in May and Go Away” crowd had to literally believe that they had found the secret to trading after the axiom holding up two years in a row! I want to ask you, traders, out there where were the major bullish signals during this time period? There certainly was no significant bullish trend to trade with. Maybe a short-term play off a bounce of the 200-day moving average in June? A break of horizontal resistance in October?
I would argue the strongest signal during this time period (from a bullish perspective) was the establishment of a very easily identifiable support zone that formed in the months of August, September and early October. Traders looking to reenter the market after a downswing often look for the formation of a strong support zone as part of their reentry strategy. The bears had several opportunities to send price lower during this time period but failed to do so which led to many reversal signals produced in the month of October.
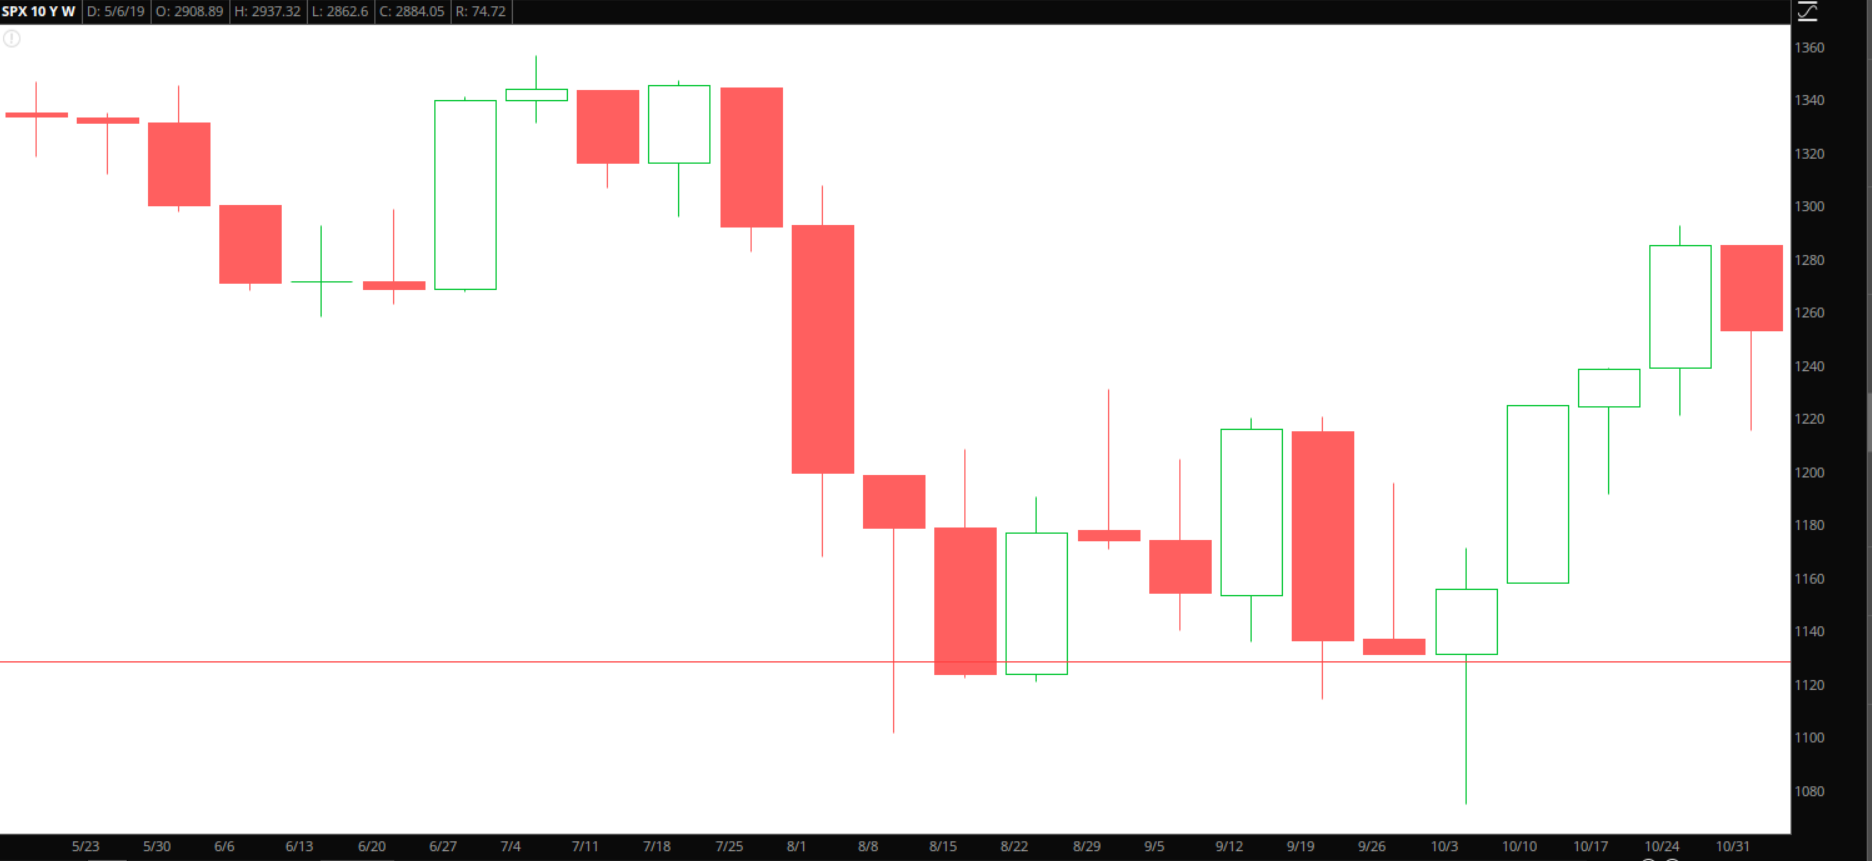
When the market broke the 200-day moving average a strong bearish signal was produced. When the market formed a strong support area a bullish reversal foundation was set up. May axiom followers certainly crowded but technical signals still ruled the time period.
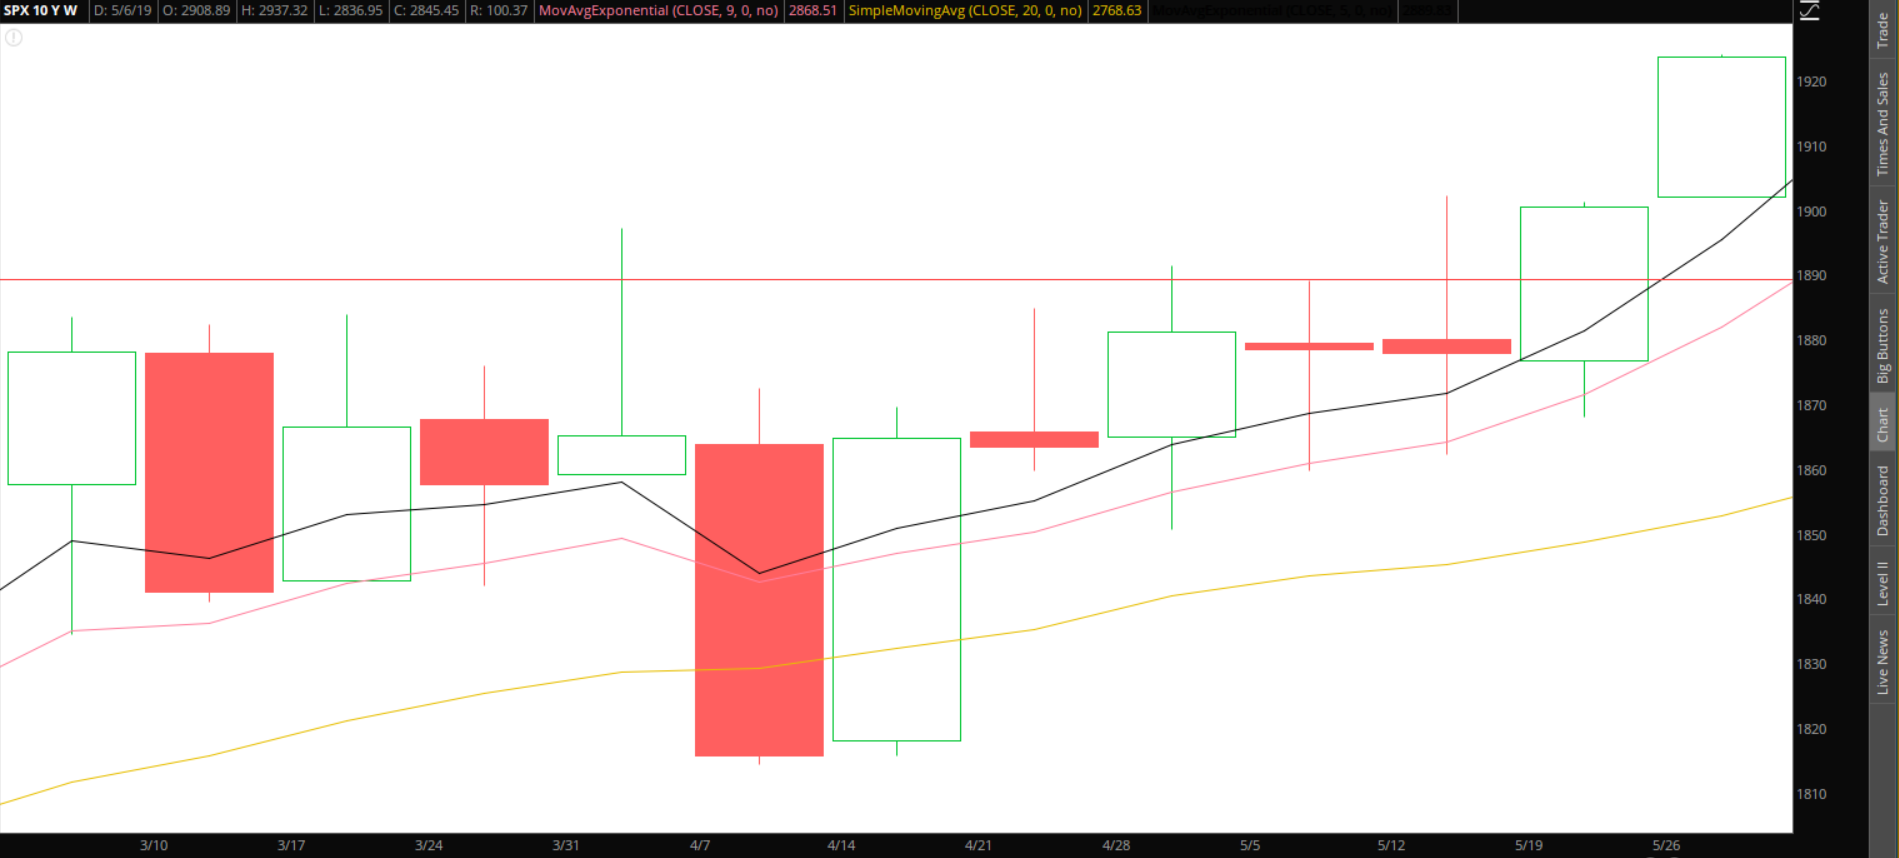
May to October 2012
- April Closing Price 1397.91
- October Closing Price 1412.16
Three in a row!!! That’s three exclamation points for those counting at home. With price roughly ending in October where it started in April, this is where I started having many heated conversations with people who started to believe that not only “Sell in May” was a cute saying but religious gospel. I mean if it happened three times in a row it must be true! Right? Let me save you countless hours spent in my graduate statistical classes. It takes a lot higher numbers than three for something to have statistical significance to it.
From a trading standpoint, this is one of the most interesting time periods in the last ten years to me. Let’s look at it from a technical standpoint using moving averages. Price plummeted at the start of May in 2012 but found support quickly at the 50-weekly moving average as signified by the red-line on this chart.
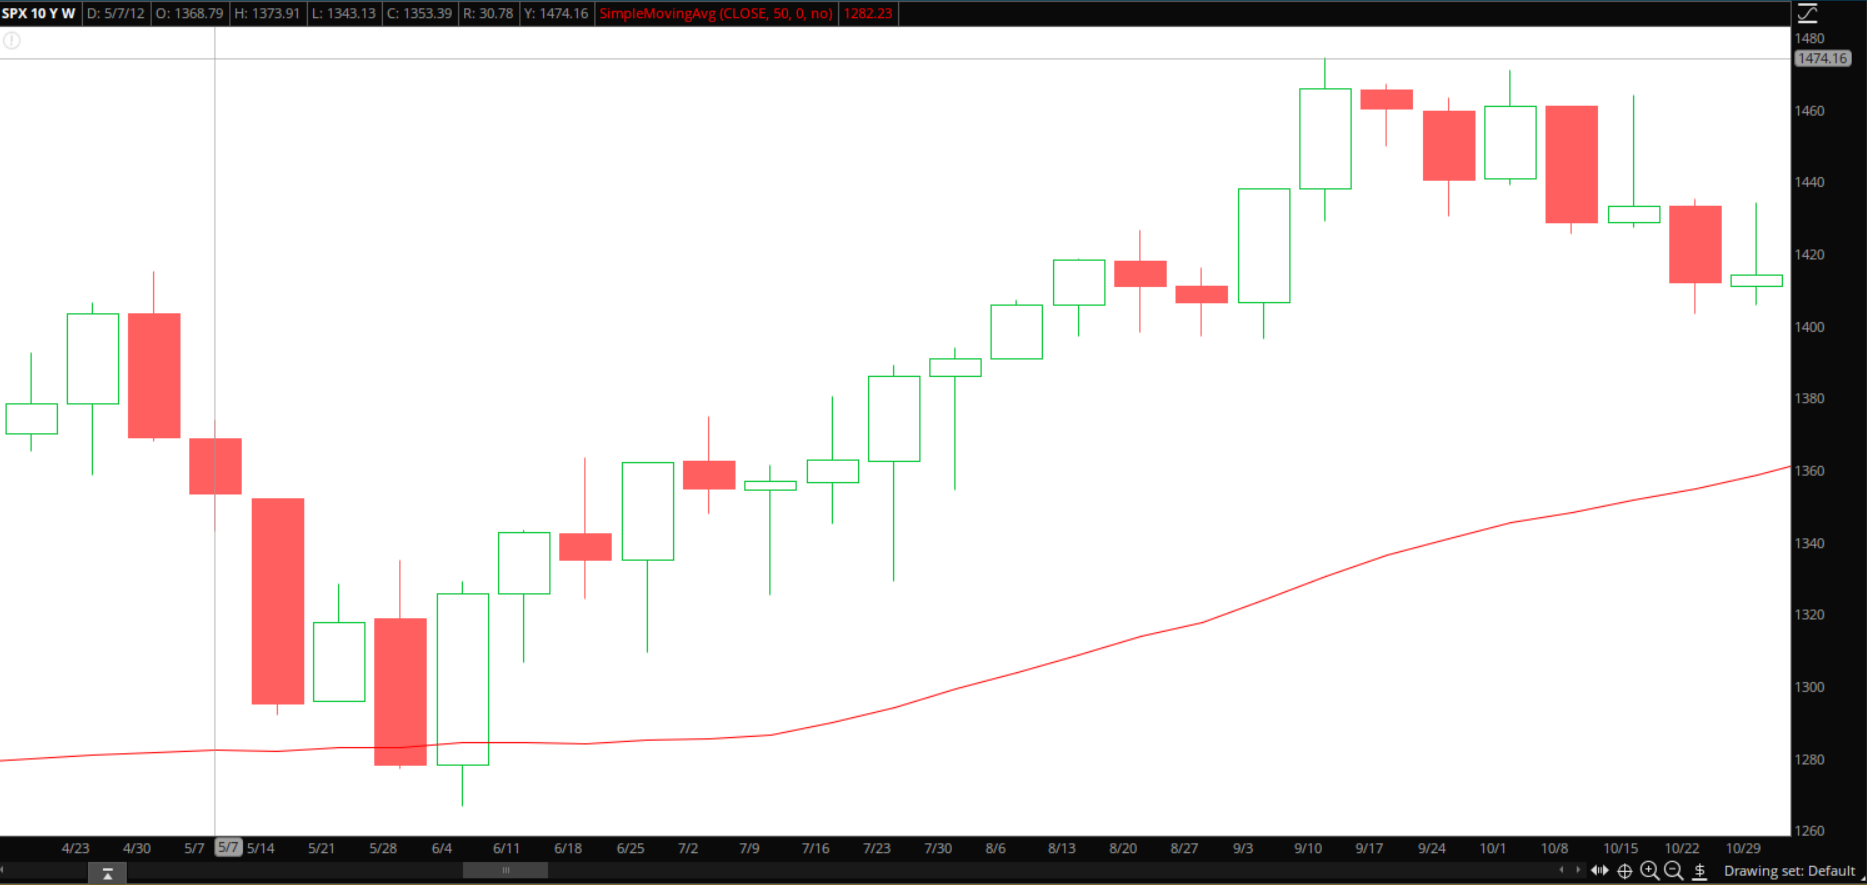
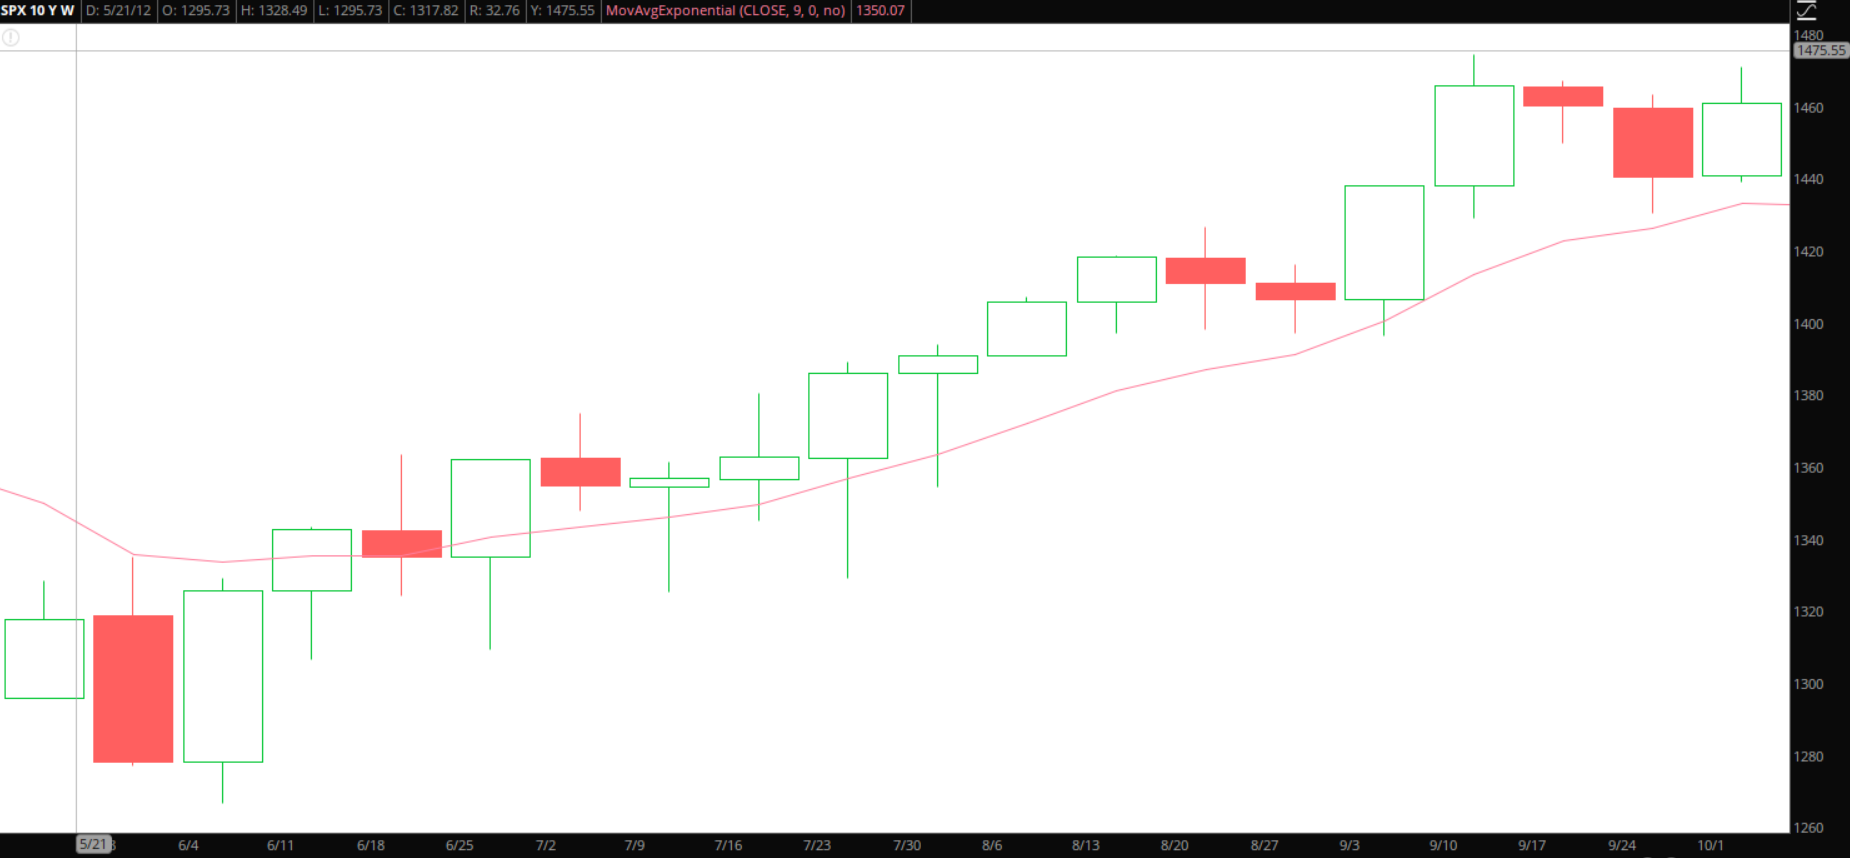
After finding support at the 50-weekly one of my favorite trend reversal signals was produced as price closed above the weekly 9-ema.
Think about this. When you only look at it from the forest vantage point price roughly ended in October where it ended in April giving credence to the “Sell in May and Go Away” axiom. However, when you look at it from a “hey, forget the forest let’s look at the trees” standpoint you see a very nice prolonged uptrend occurred amid the forest. Price stayed above the weekly 9-ema for 16 of 17 weeks! Once again trading signals ruled the day and those that “stayed away” apparently had better things to do with their money.
May to October 2013
- April Closing Price 1597.57
- October Closing Price 1756.54
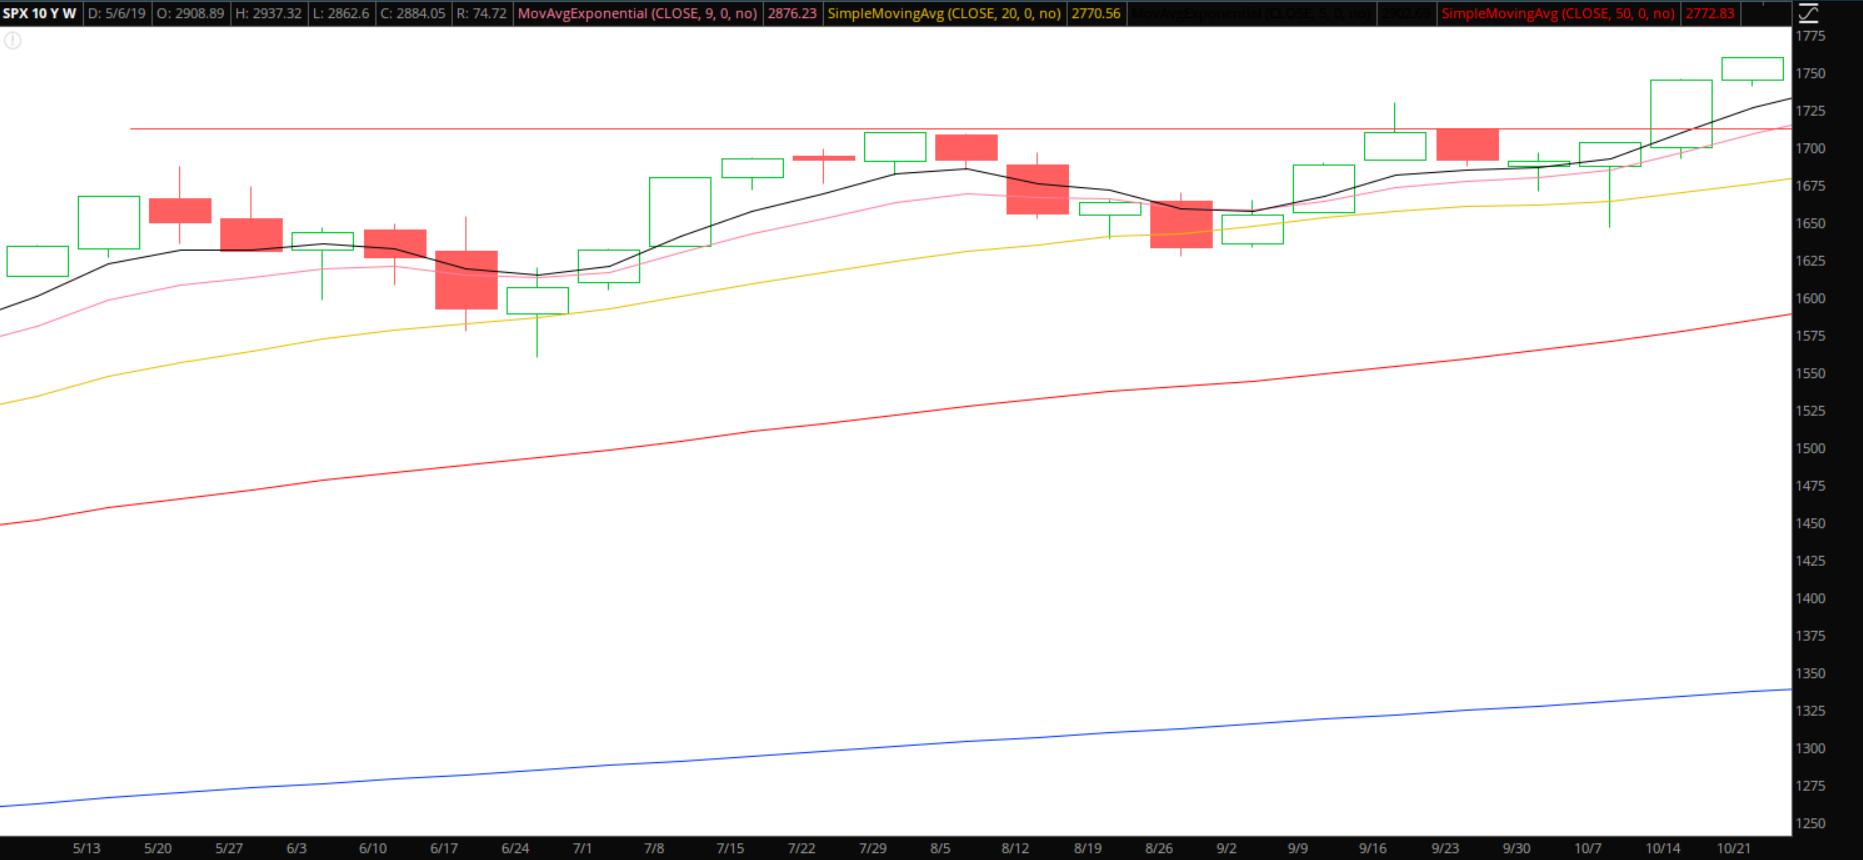
The three-year streak of selling in May and going away snapped which by (by absolutely no coincidence) marked one of the steadier uptrends during these first few years of this study. Very few new traders use weekly charts in their chart analysis which I believe is a mistake. Even if you are not a moving average junkie like me (you should investigate that by the way) weekly charts allow you to see trends and support and resistance areas more clearly.
While axiom followers were staying away, traders had a painfully boring and profitable uptrend to work with. Higher lows established along the way, profitable pullbacks to the 20-weekly moving average and a clear break of resistance towards the end of the time period that led to quite a rally in the months that followed. Technical analysis and the power of trends profitably working during the entire time period.
May to October 2014
- April Closing Price 1883.95
- October Closing Price 2018.15
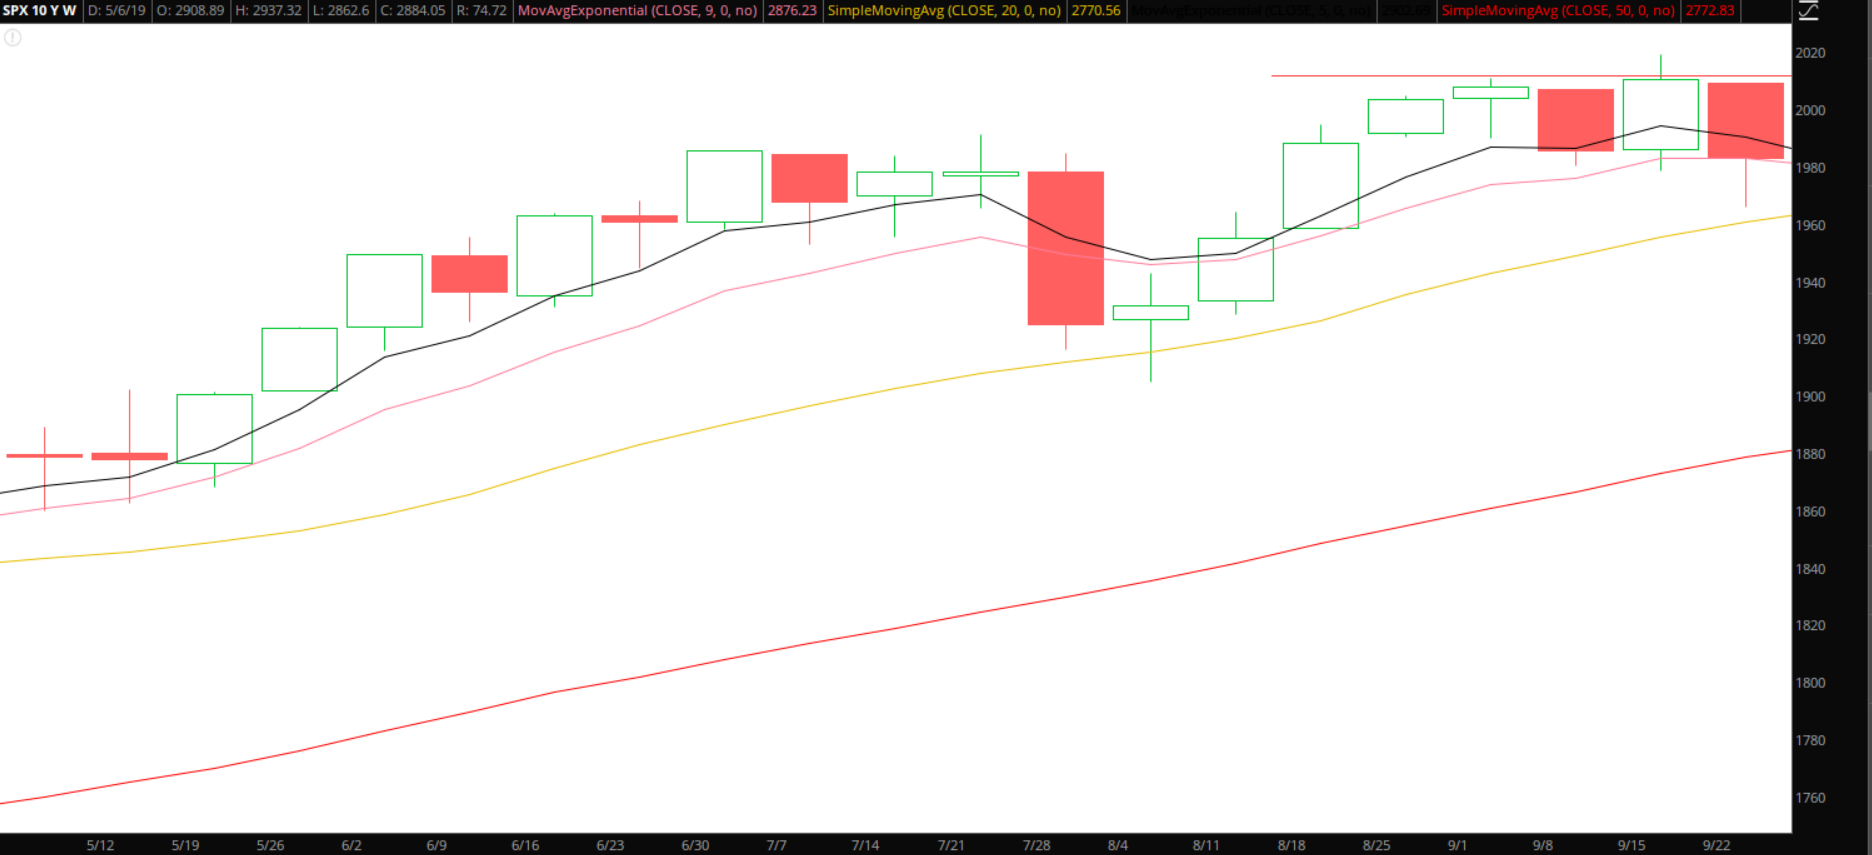
Like 2013, May 2014 started the time period in an uptrend and like 2013 the trend was a trader’s friend. Maybe the saying should be “Sell in May and Go Away…Unless the market is in an uptrend.” This time period also provides one of the starkest examples of adhering to the principals of Technical Analysis versus blindly following an axiom.
The markets were trading sideways in a multi-month consolidation pattern heading into the start of May in 2014. When price breaks out to the upside of a multi-month consolidation pattern this is a strong bullish signal. Were traders supposed to ignore this very powerful bullish signal just because it occurred in the first weeks of May? Strong price appreciation would occur for several weeks providing countless trading opportunities along the way. We can take into whatever factors we want as traders but when a powerful signal comes along, we would be wise to take advantage of it whether it occurs in May, July, November or any other month.
May to October 2015
- April Closing Price 2085.51
- October Closing Price 2079.36
Price essentially closed at the same point that it opened at for this time period and bulls did not enjoy the same setup heading into and at the start of May that they had benefited from in the past couple of years.
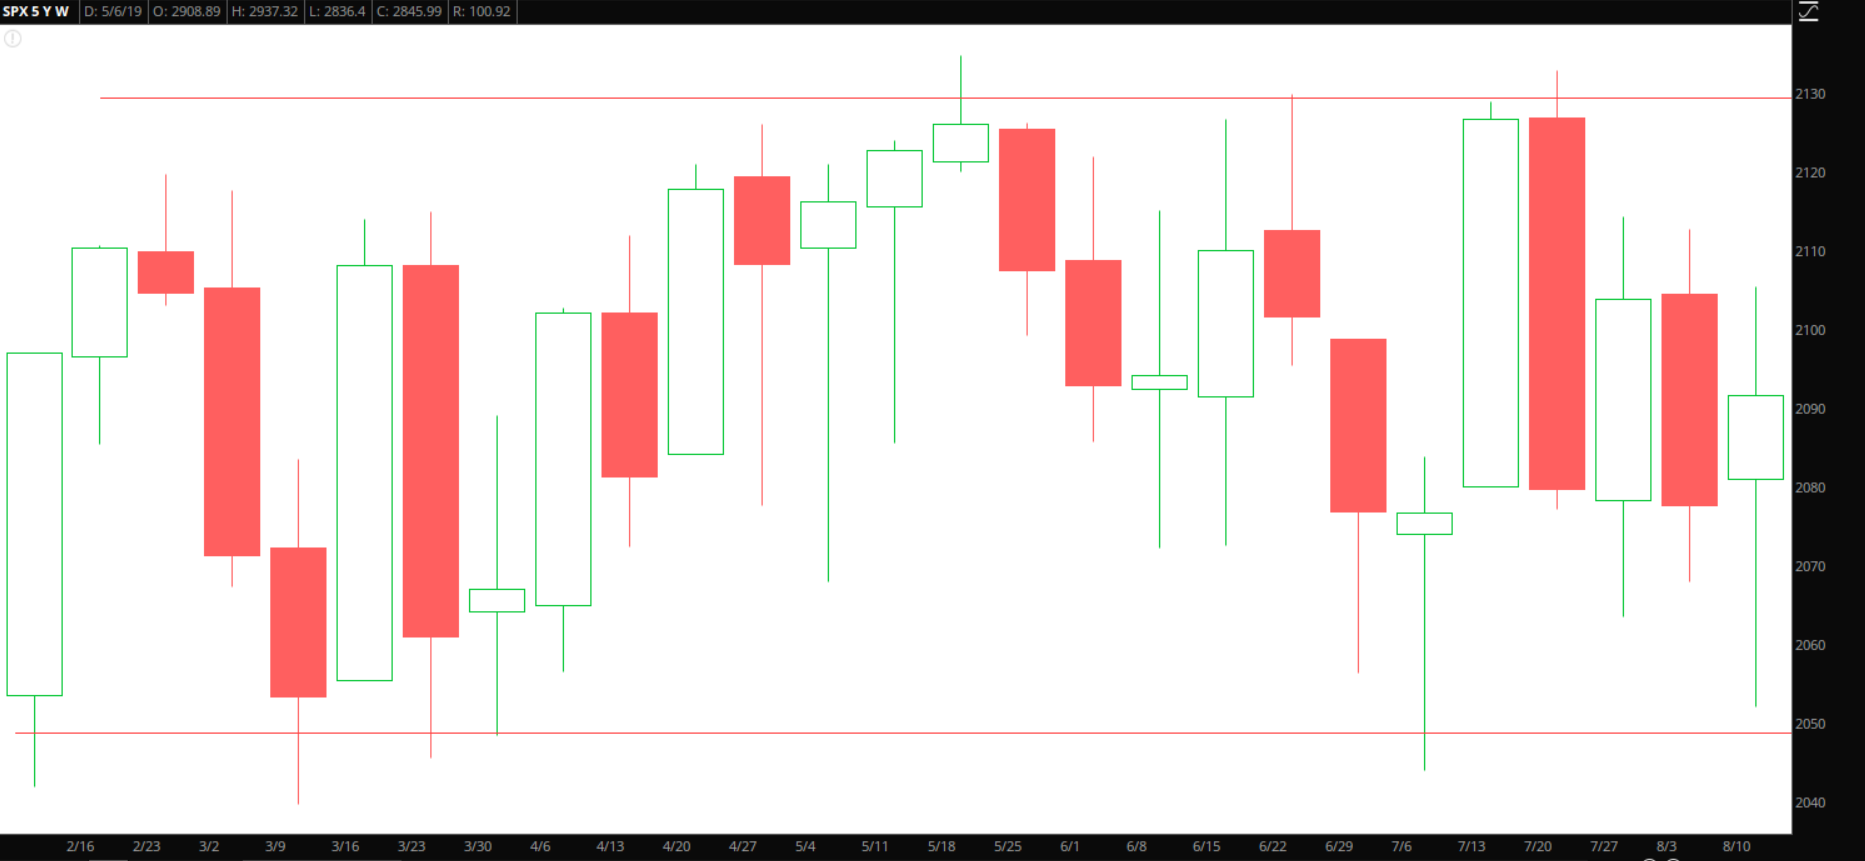
The markets were trading in a consolidation pattern in the months heading into May and this pattern would continue for several more months. While there are several key signals traders can look for to trade while stocks or markets are trading sideways, clear breaks of resistance or support are perhaps some of the strongest trading signals that patient traders wait for. Support finally broke on news involving China in August.
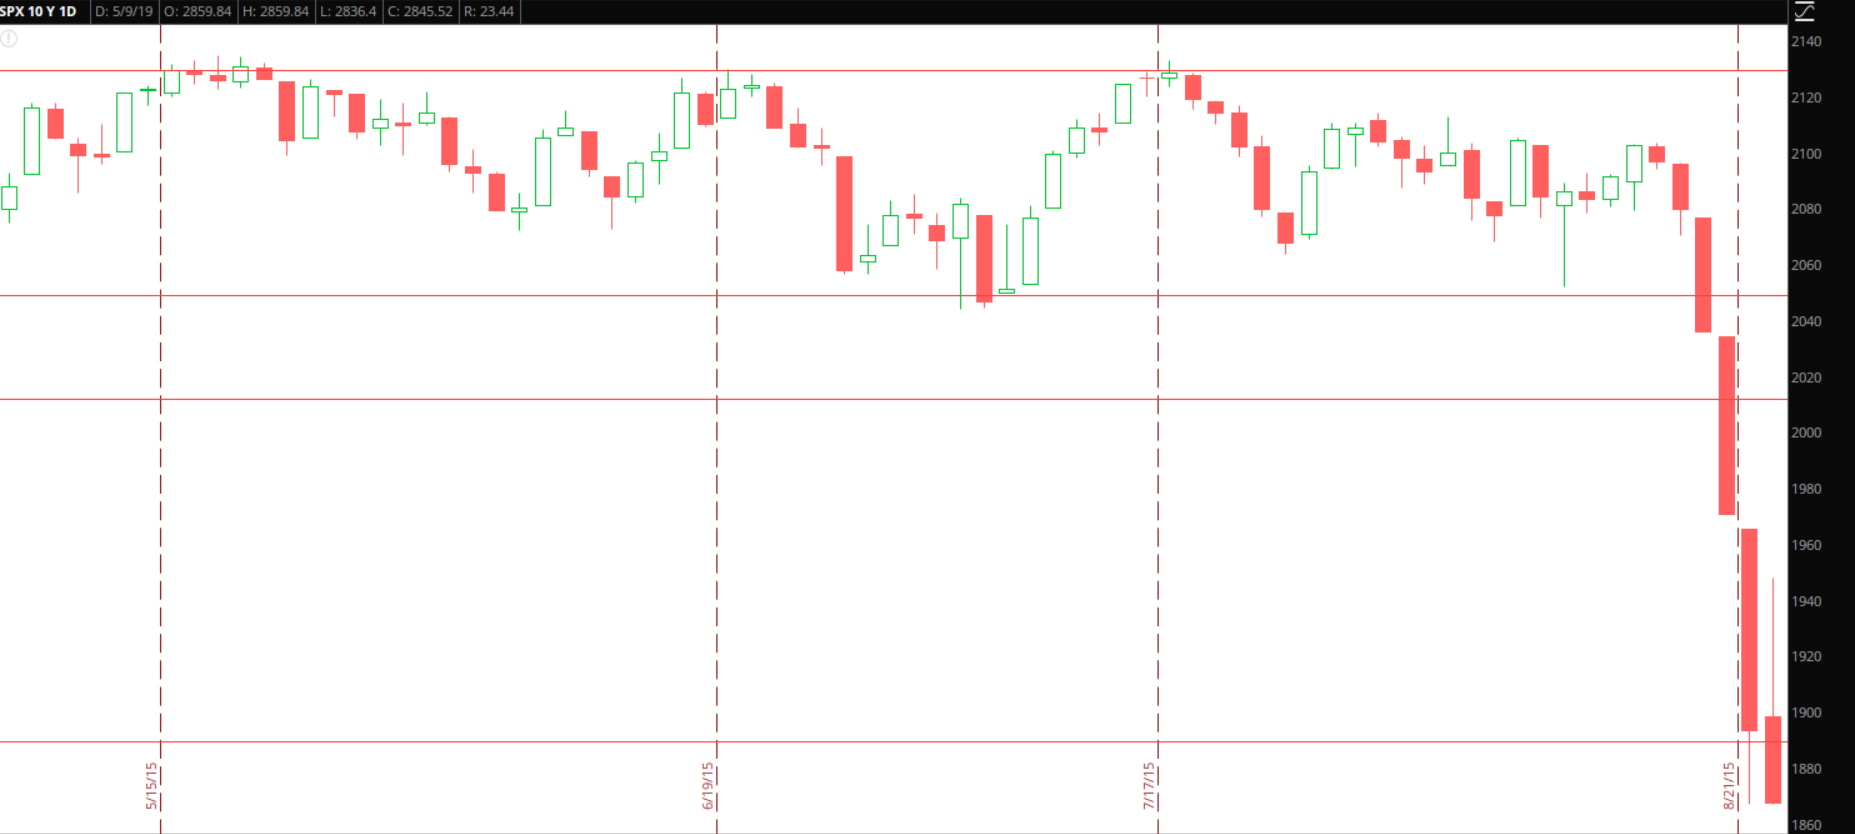
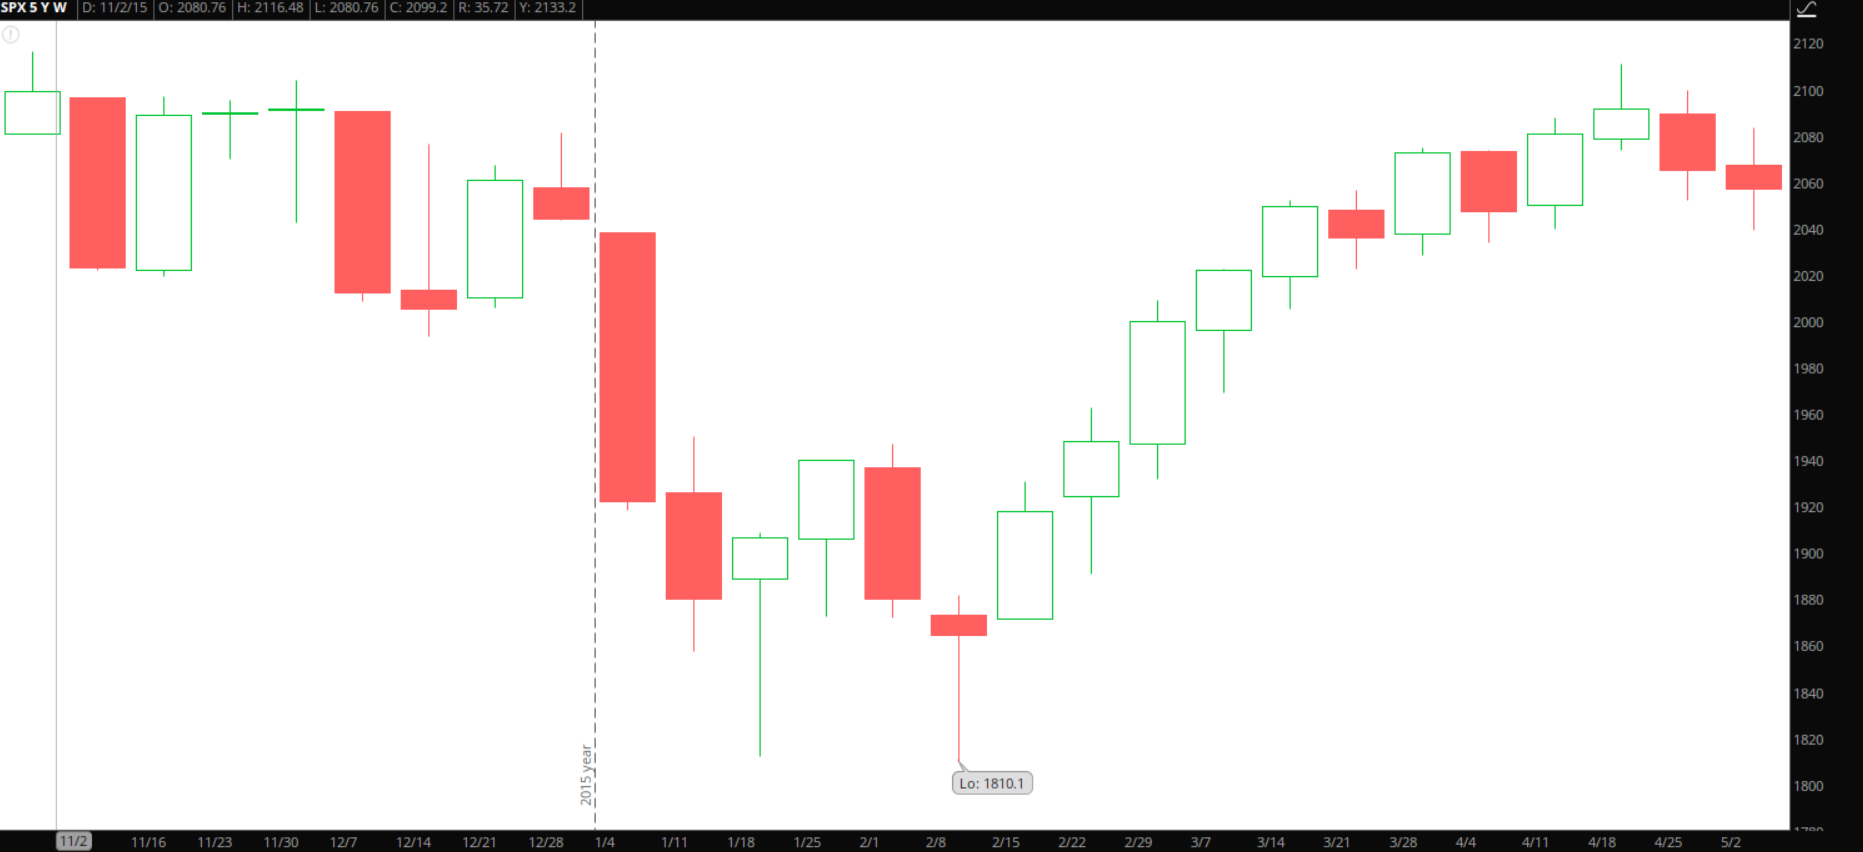
When multi-month consolidation patterns break the short-term price movement can be very strong. While the sell in May crowd might point to this time period as another example of being out of the market from May to November, it really was just a year to stay out of the market altogether as the following November 2015 to April 2016 time period didn’t do much better.
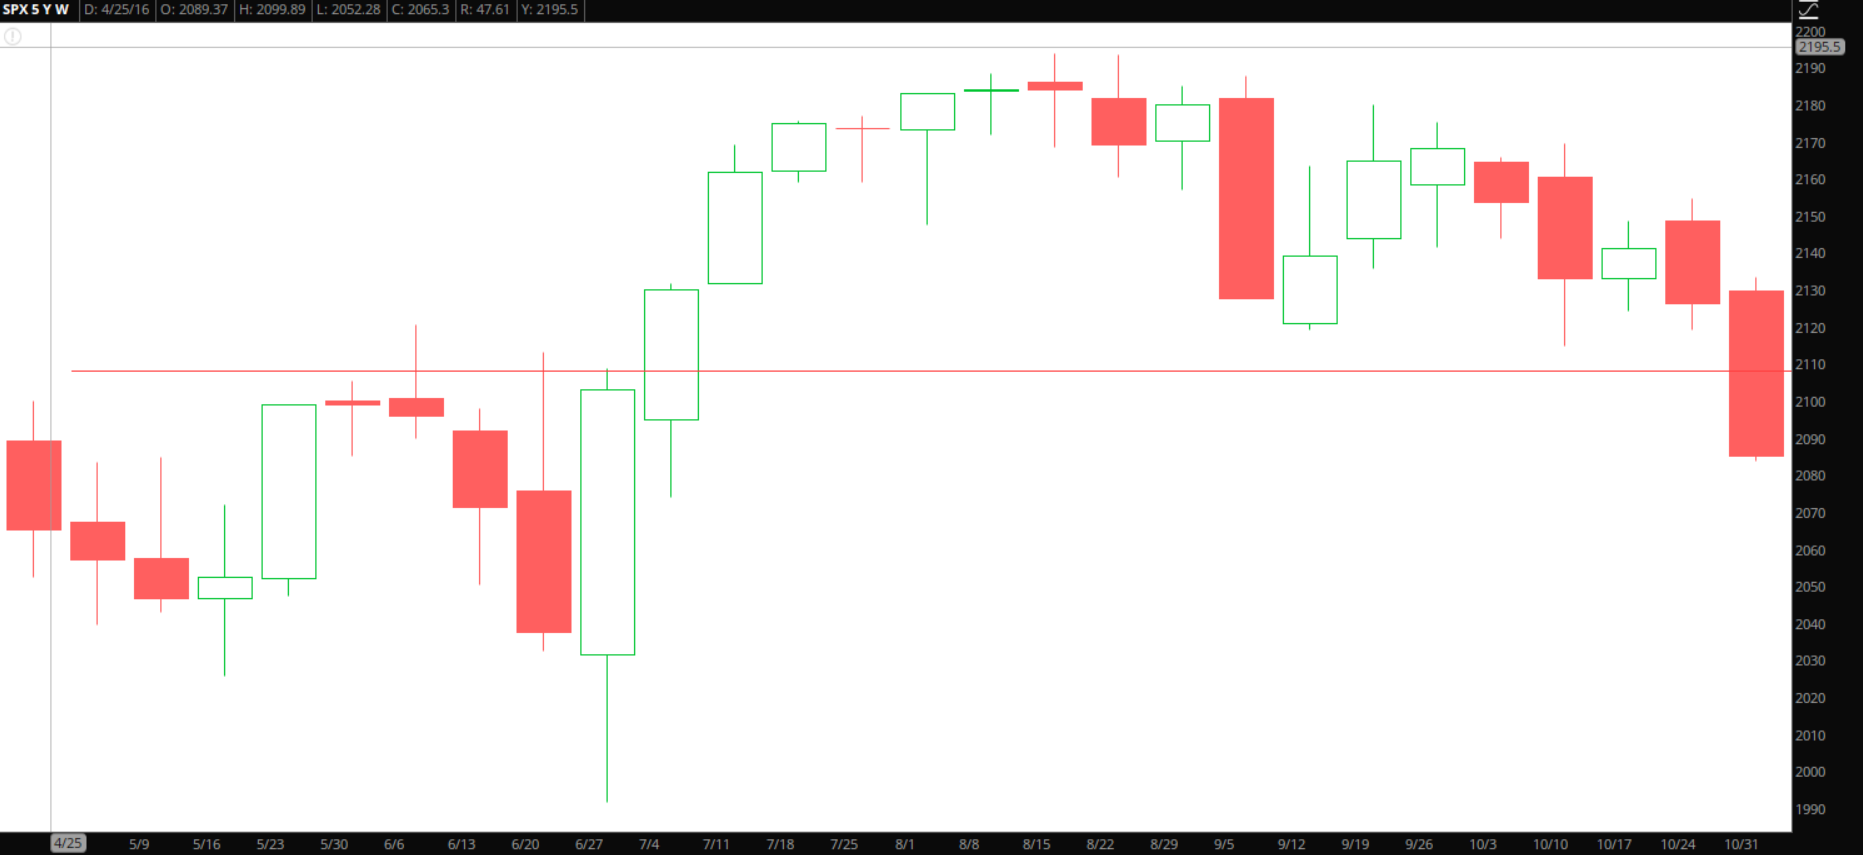
May to October 2016
- April Closing Price 2065.30
- October Closing Price 2126.15
Slight price appreciation for this time period but bears looking to go bearish based on this popular axiom didn’t get a clear signal until late October as the markets were selling off the week before the presidential elections. A strong breakout signal occurred at the start of July providing short-term trades a nice short-term opportunity. If nothing else this look back in history should cement in your head that when breaks of multi-month consolidation occur, you want to take advantage of them in the short-term regardless of when they occur. They won’t ever produce 100% winners (no signal ever does) but as has been seen can be very profitable signals in the short-term.
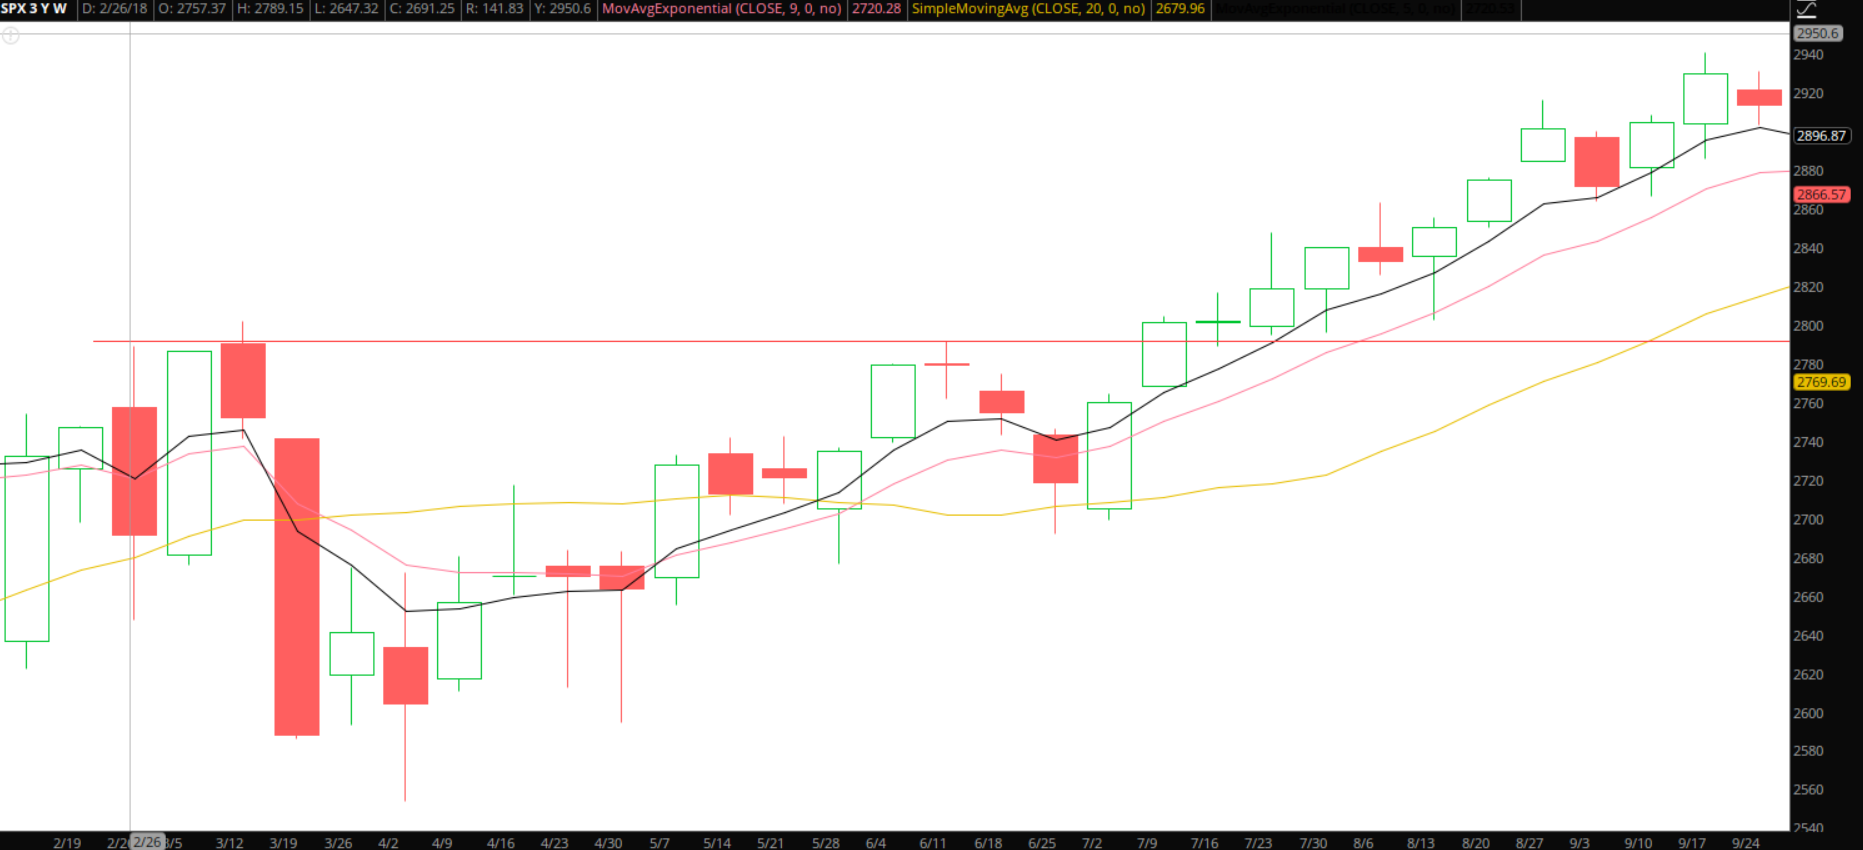
May to October 2017
- April Closing Price 2384.20
- October Closing Price 2575.26
This time period was beautiful. Once again, we had a bullish trend heading into this time period and once again trading with the trend was far more powerful axiom than “Sell in May and Go Away.”
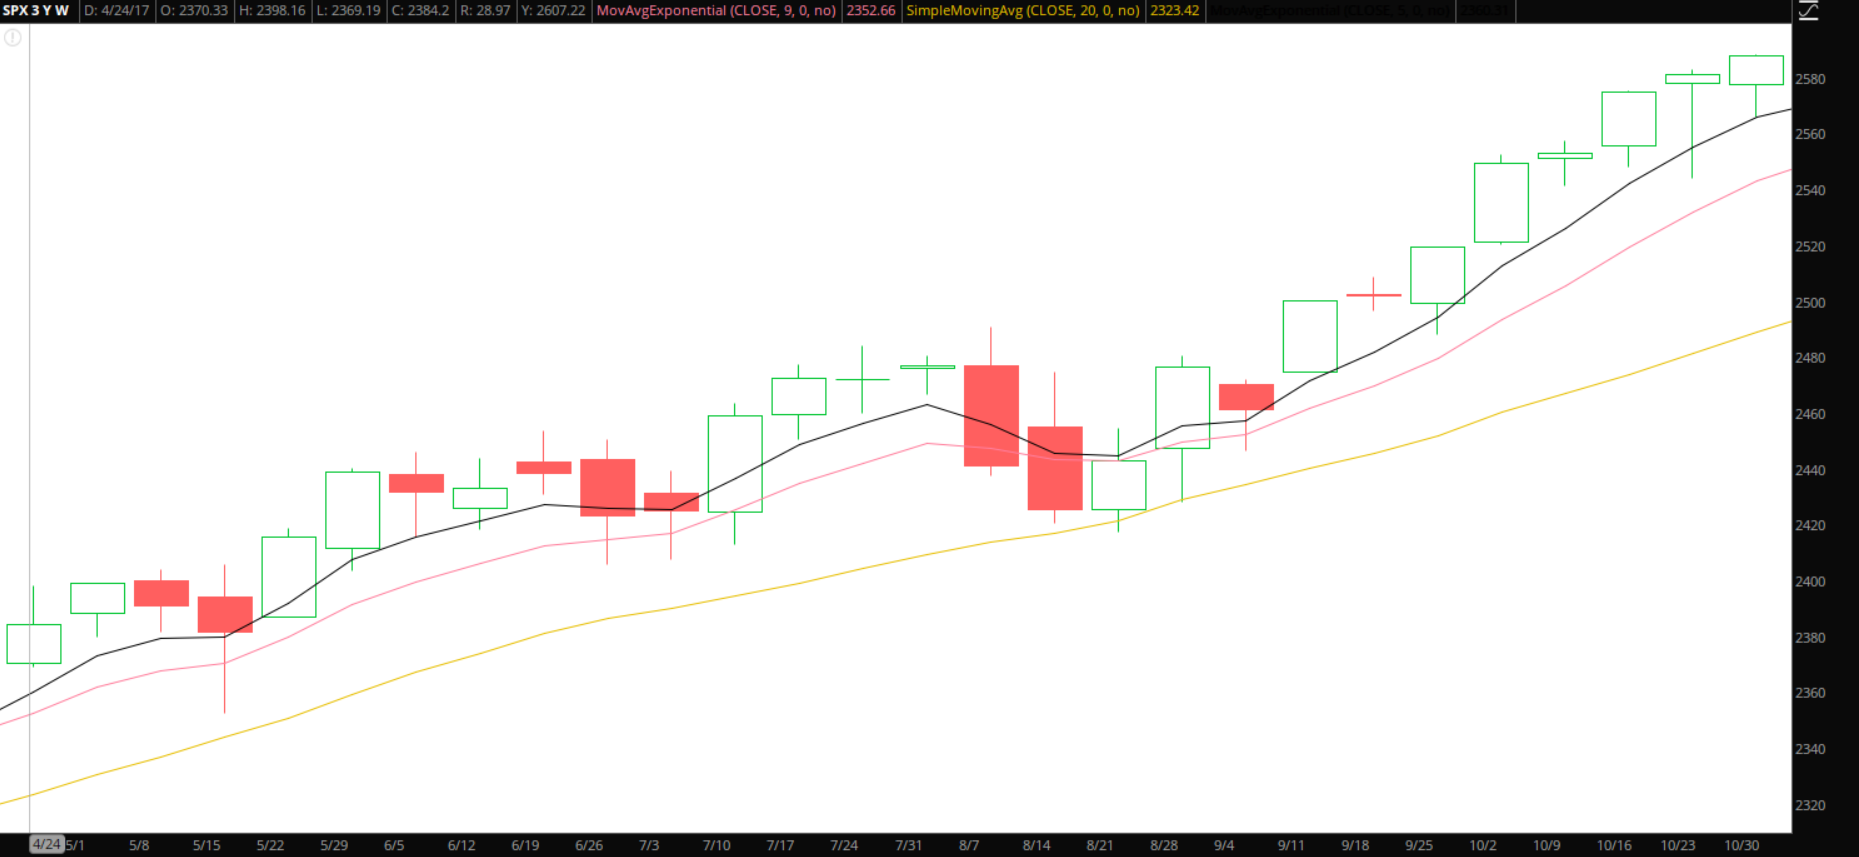
Coming off the presidential elections the market was in a very bullish posture. The hopes of tax cuts and deregulation fueled bullish sentiment and economic data around the globe was stellar. Chants of “synchronized global growth” were the rallying cry. The technical signals during this time period were amazing. The pullbacks were orderly, the breakouts profitable…it simply was part of a time period that was one of the easiest trading environments in the last ten years.
Individuals that understood the fundamental and sentimental context driving the market knew what was happening. Even traders who only adhere to technical analysis saw bullish signal after bullish signal. All trends eventually come to an end but traders who don’t try to guess when that will occur were handsomely rewarded during this time period.
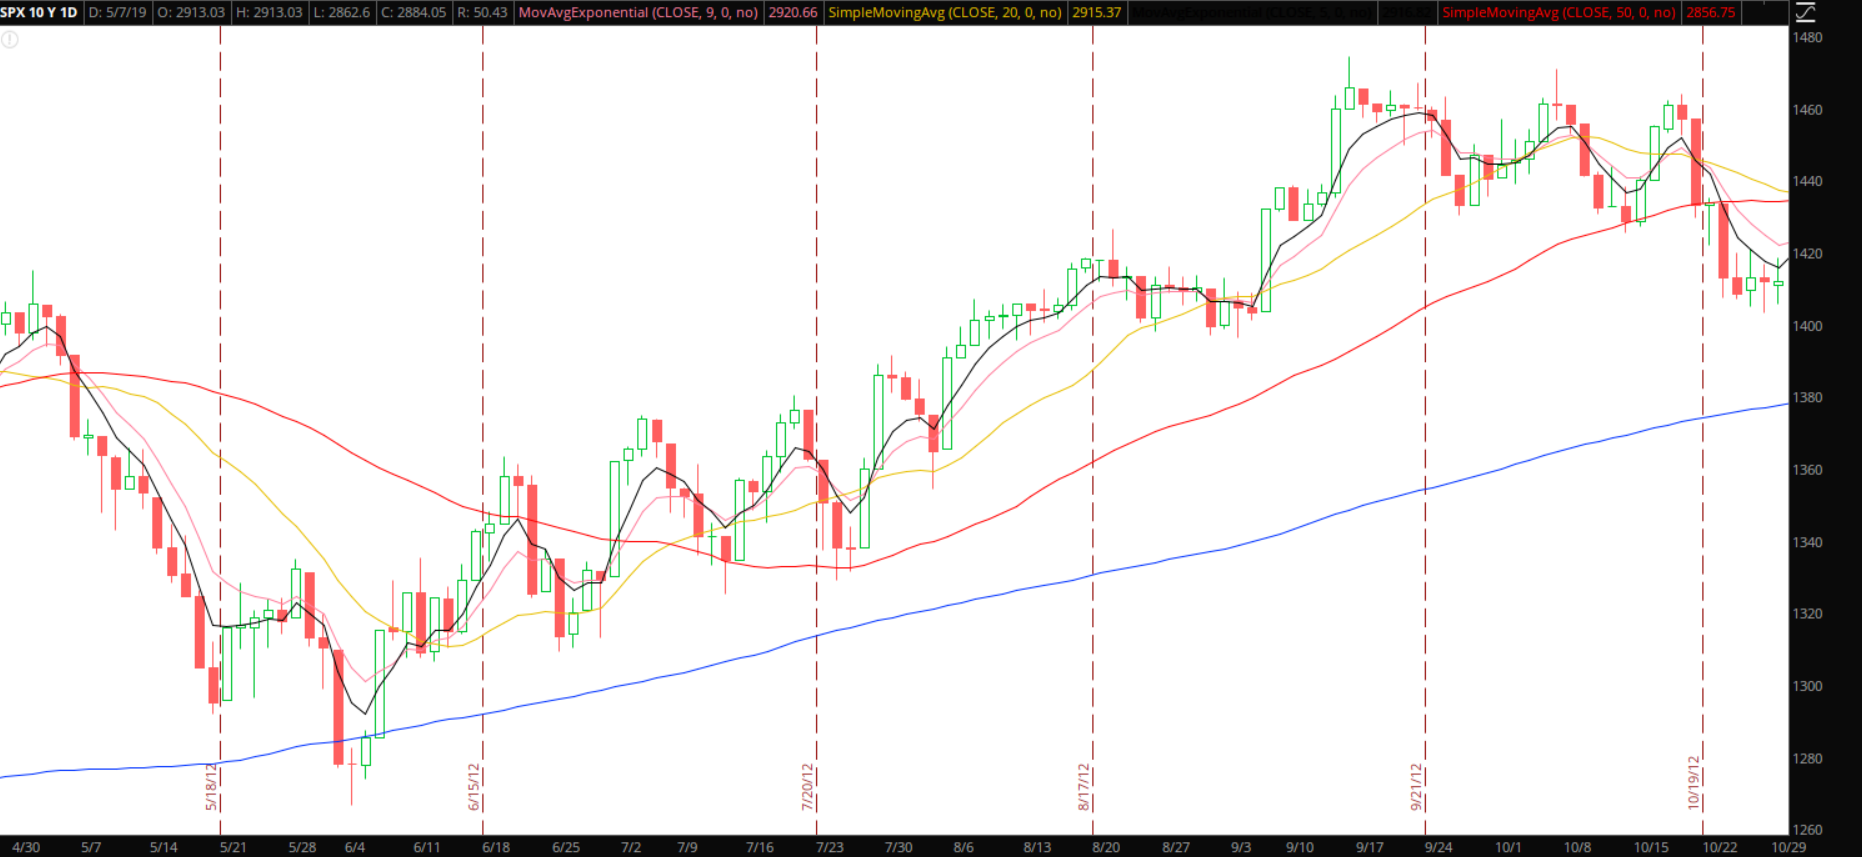
May to October 2018
- April Closing Price 2648.04
- October Closing Price 2711.74
Last year saw slight appreciation for the overall time period but it certainly had its own unique story to tell.
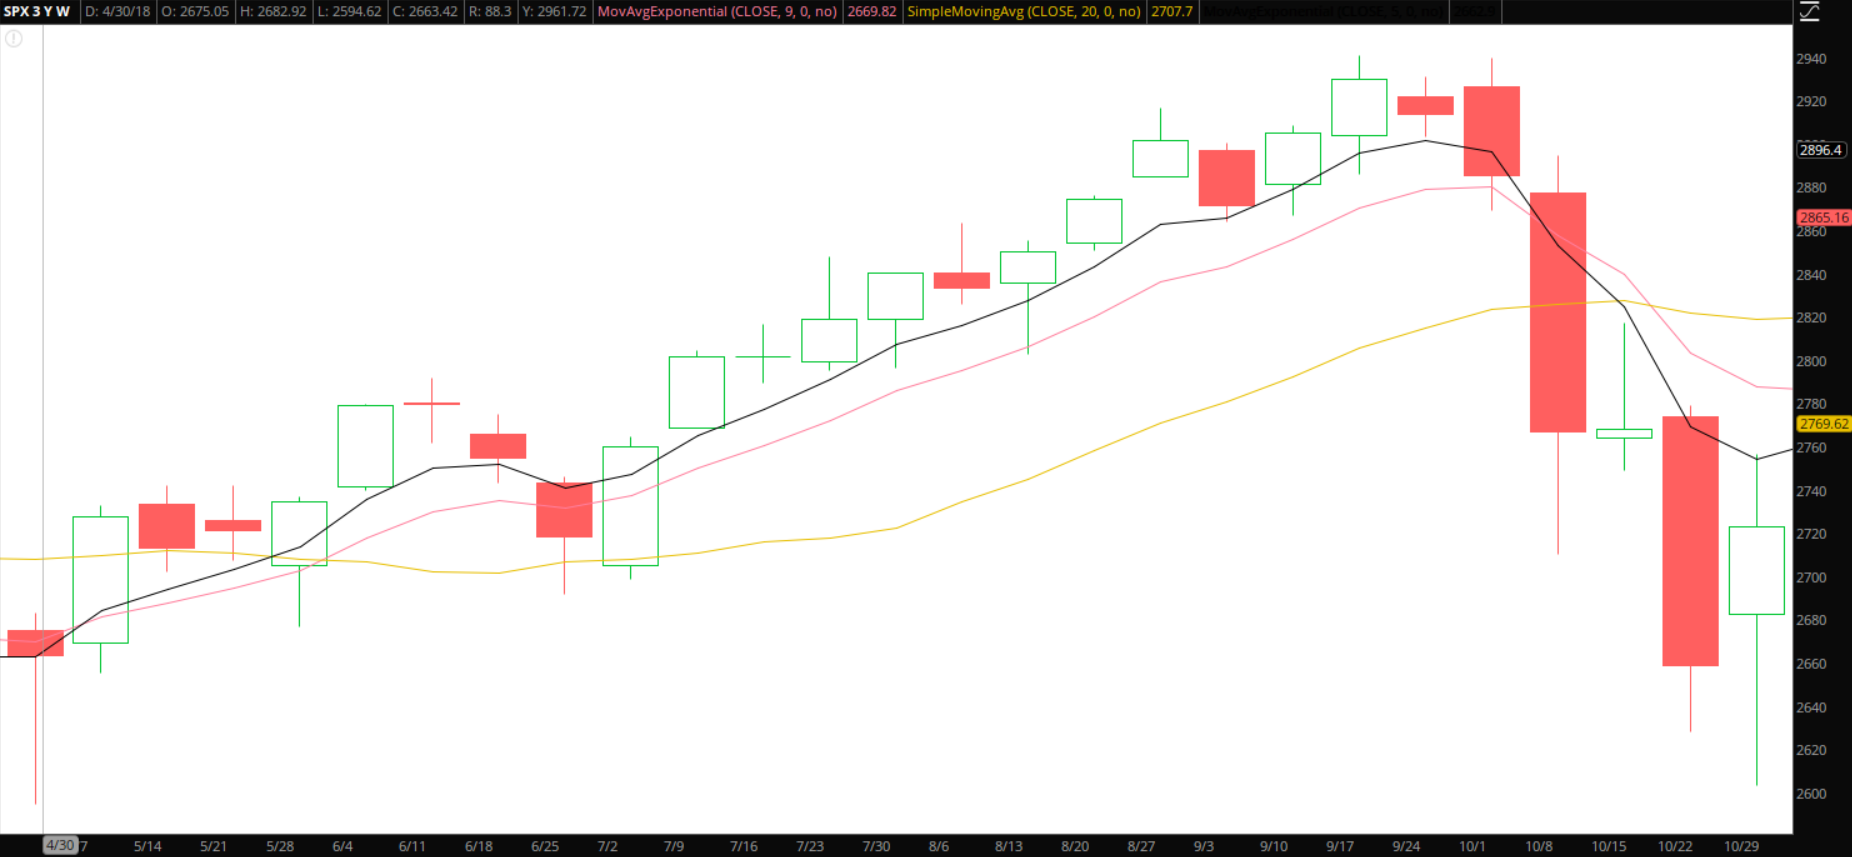
While 2018 as a whole saw the market have the most volatility in several years, the most powerful short-term trend during the year did not occur in November through April but right at the start of May…when axiom cultists were banging their drums to sell and go away. Coming into May, the market was heading out of a time period where worries of a trade war (sound familiar?) had spooked the market. As these fears started to subside, bullish signals started to be produced at the start of May with a close above a key technical trend indicator, the 20-weekly moving average (the gold line on the chart).
While price action was choppy, as price broke out of resistance levels (once again with the breakouts…its almost as if it is a strong signal or something) price took off for several weeks producing a nice short-term trading environment.
Once again, I rhetorically ask, are traders simply supposed to ignore these bullish signals because of some dogma about leaving the market from May through October? The easiest bullish environment during the year occurred during this time period and traders that recognized this breakout were able to make many profitable bullish trades in the two months that followed.
While the price was up overall during this time period analyzed, the market certainly gave back a good chunk of their gains at the end of October, but it certainly did not do so before producing a powerful signal that I personally use in all my analysis.
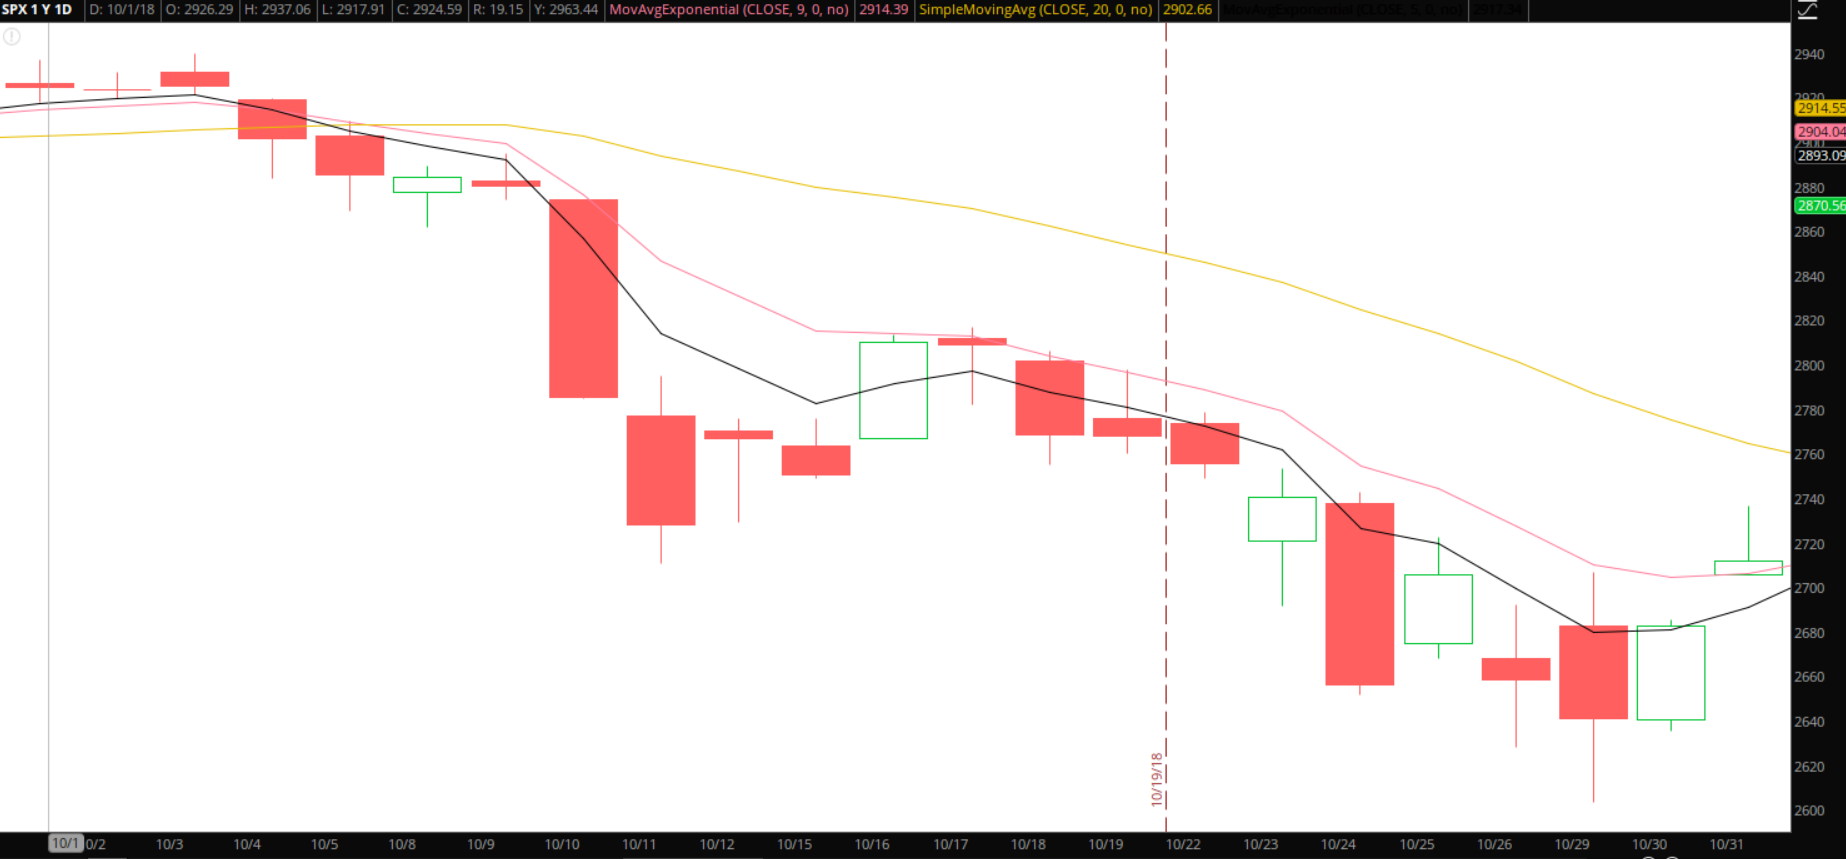
On October 4th price closed below the 20-day moving average with additional downward confirmation occurring the next day. This bearish signal does not mean I start firing off short positions or buying puts like they are going out of style as many other factors must be taken into consideration (overall trend, market sentiment, etc.), I do use it as a stop-loss technique. Considering the strength of the previous trend, similar traders likely gave back some profit from previous longer-held trades or took a small loss on newly initiated trades.
We use trade management techniques to avoid what was about to occur. As short-term support levels broke a short-term downtrend occurred with the daily short-term moving averages (the 9-ema signified by the pink like and the 5-ema signified by the black line) acting as resistance. No strong bullish reversal signals were produced during these weeks so patient bulls waiting for signals to reenter simple sat on the sidelines.
This time period, as many are, was dominated by the power of trends. Buy and hold investors had a market that ended a little higher than where it started. Traders who adhere to technical analysis had the strongest bullish trend in 2018 during the summer (when they were supposed to go away) and had clear signals to lock in profits and not enter new bullish trades once the October sell-off occurred. The savviest of traders played the uptrend in the summer and took advantage of short-term bearish signals in the month of October.
May to October 2019
- April Closing Price 2945.83
- October Closing Price ???
I might have banged my head on the wall a few times in the last few days after having a conversation with someone on the whole “Sell in May and Go Away” topic. The conversation went something along these lines:
- Other Individual: See this is why you go bearish in May!
- Me: Well the historical data certainly points to lower returns over the history of the market from May to October but that whole saying refers to the time period, not the month of May in an isolation bubble
- Other Individual: I am going bearish
- Me: Why?
- Other Individual: Because you sell in May
- Me: Well Trump is certainly helping your general thought process with his Tweets
- Other Individual: Yeah but that is just the catalyst. The market is just looking for a reason to sell in May and that is it and it likely will tank from here
- Me: Did you know that in the last five years the market has ended higher from May 1st to May 31st?
- Other Individual: No but it just feels like it wants to sell this time.
Whenever a trader brings up feeling in analyzing the market, I check out of the conversation. I go bang my head against the wall and few times and move on with my day.
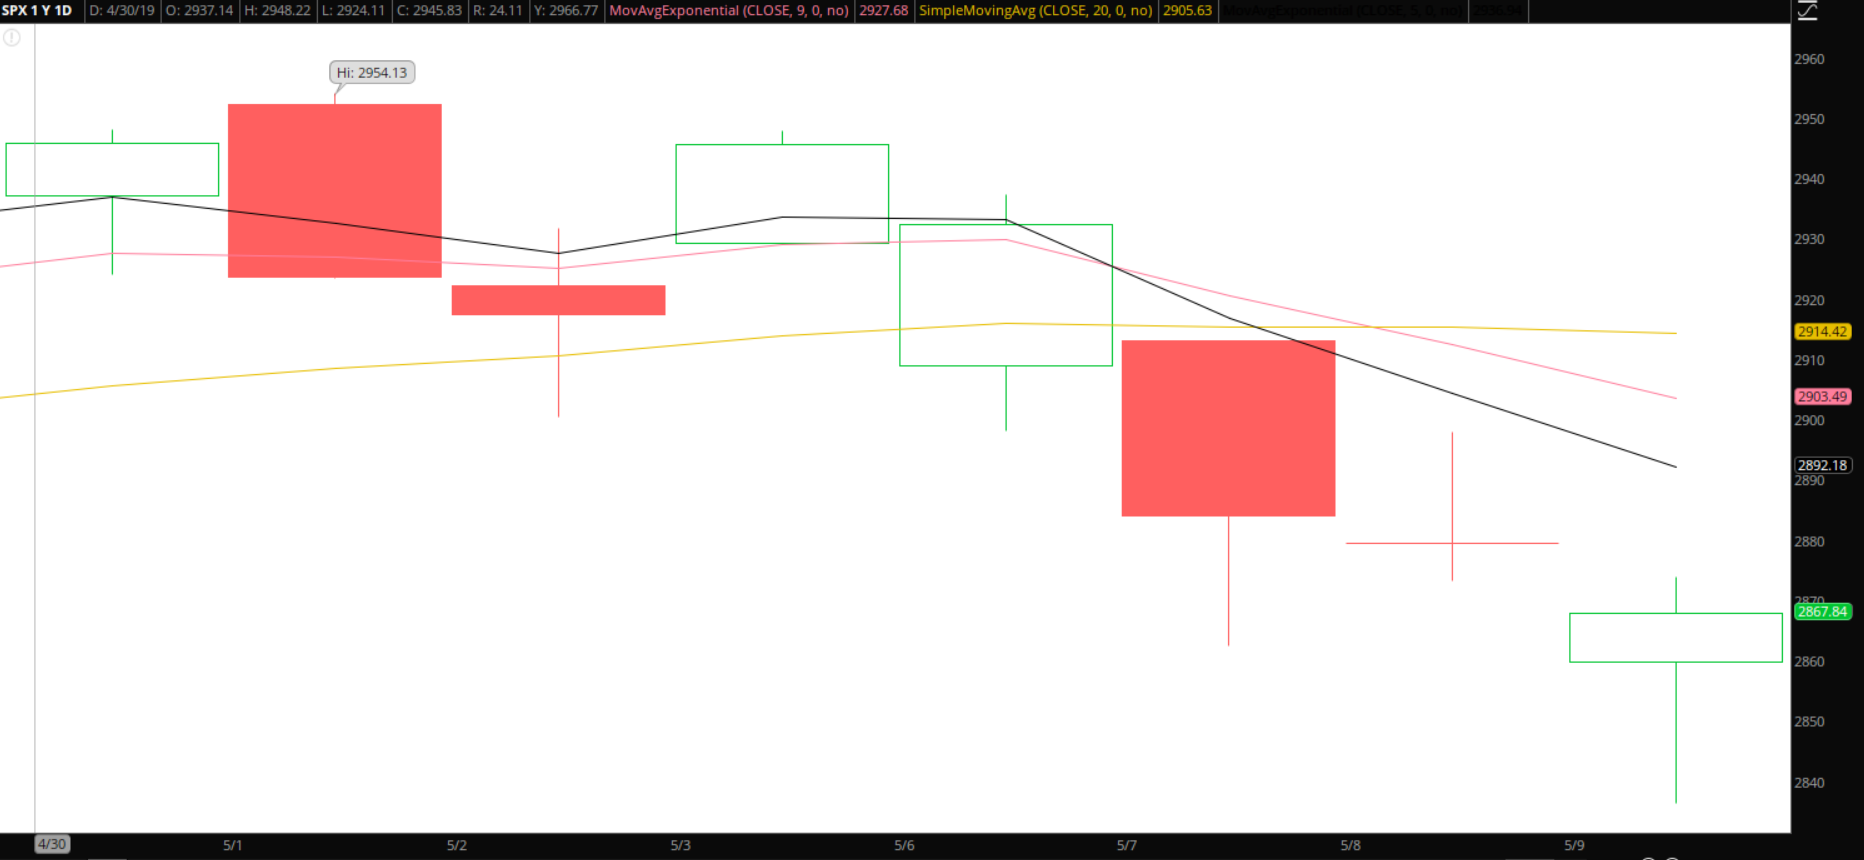
At the time of the writing of this newsletter, the market has had its most pronounced sell-off of the year coinciding with the start of the month of May. General thought process regarding this well-known axiom falls along four camps right-now.
- Camp One: See, you sell in May and go away!
- Camp Two: See, you go bearish in May!
- Camp Three: The market is looking for a reason to sell in May and Trump’s tweets gave it the reason.
- Camp Four: The market is going down based on the volatility concerning the trade war and nothing more.

Conclusion
Here are my conclusions and closing comments to each of these camps.
To Camp One
The historical evidence of the entire history of the market does point to lower returns during the months of May through October compared to November through April. For buy-and-hold investors who are looking to enter the market for the very first time who have zero knowledge nor desire to manage their own portfolio, one could make a case that your initial entry should occur in November compared to May as the data shows that historically to be the case. It should be noted that in the last five years the returns for these time periods have been very minimal. To other passive buy-and-hold investors I ask the simple question, do you have better returns available to you or do you just plan on sitting in cash during these months?
To traders, as the last ten years have shown there have been many instances of very strong signals produced during these months which you could have capitalized on. Many powerful trends that had nice orderly and profitable pullback signals. AT A MINIMUM, playing breakouts of multi-month consolidation patterns should not be ignored during this (or any other) time period.
To Camp Two
You are wrong, naïve and likely will fail epically at trading. Blindly betting on something is not trading, it is gambling. Camp two here is something for you to dwell upon. In the last ten years, price on the S&P 500 has closed higher at the end of May from where it started the month of May 7 out of ten times. That includes the last 5 years in a row.
To Camp Three
I get what you are saying as you are likely a believer in seasonality to a degree and are looking for signals to trade in the direction of seasonal trends. I do get it. However, I would like to point out that lower returns for the months of May through November does not mean that the market is historically bearish during the months of May through November. It simply means that the over returns are lower. I would also like to ask you a similar question to camp two if the market is always looking for a reason to sell in May do you think they found zero reasons to sell the last five years? How would you explain the five-year winning streak based on your philosophy? Worse yet, with this mindset do you think you would have missed out on bullish signals in recent years?
To Camp Four
While I certainly am a believer in seasonality to some degree, I also believe this is the safest long-term camp for traders to base their analysis with regards to this axiom. If the trade-war headlines play out to cause a huge sell-off in May, you will have a whole new generation of traders who will pound the pulpit of “Selling in May” for years to come. They will ignore the past five years, likely ignore any future years of data and find this singular occurrence as all the proof they need to base their decisions in the future.
Trump potentially escalating the trade war is a huge event and would have disrupted the markets no matter what month it occurred. The fact that it happened at the start of May this year is certainly interesting, but we should not lose sight of the fact that it would have been disruptive and impactful at any time.
There is evidence of lower returns during the months of May through October which will likely keep people discussing this axiom for decades to come. However, in the decades that come there will be plenty of powerful bullish signals from May through November just like there will be plenty of powerful bearish signals. If we simply trade the signals we see on the chart I truly believe you will be much better off, no matter what day of the month they occur on.