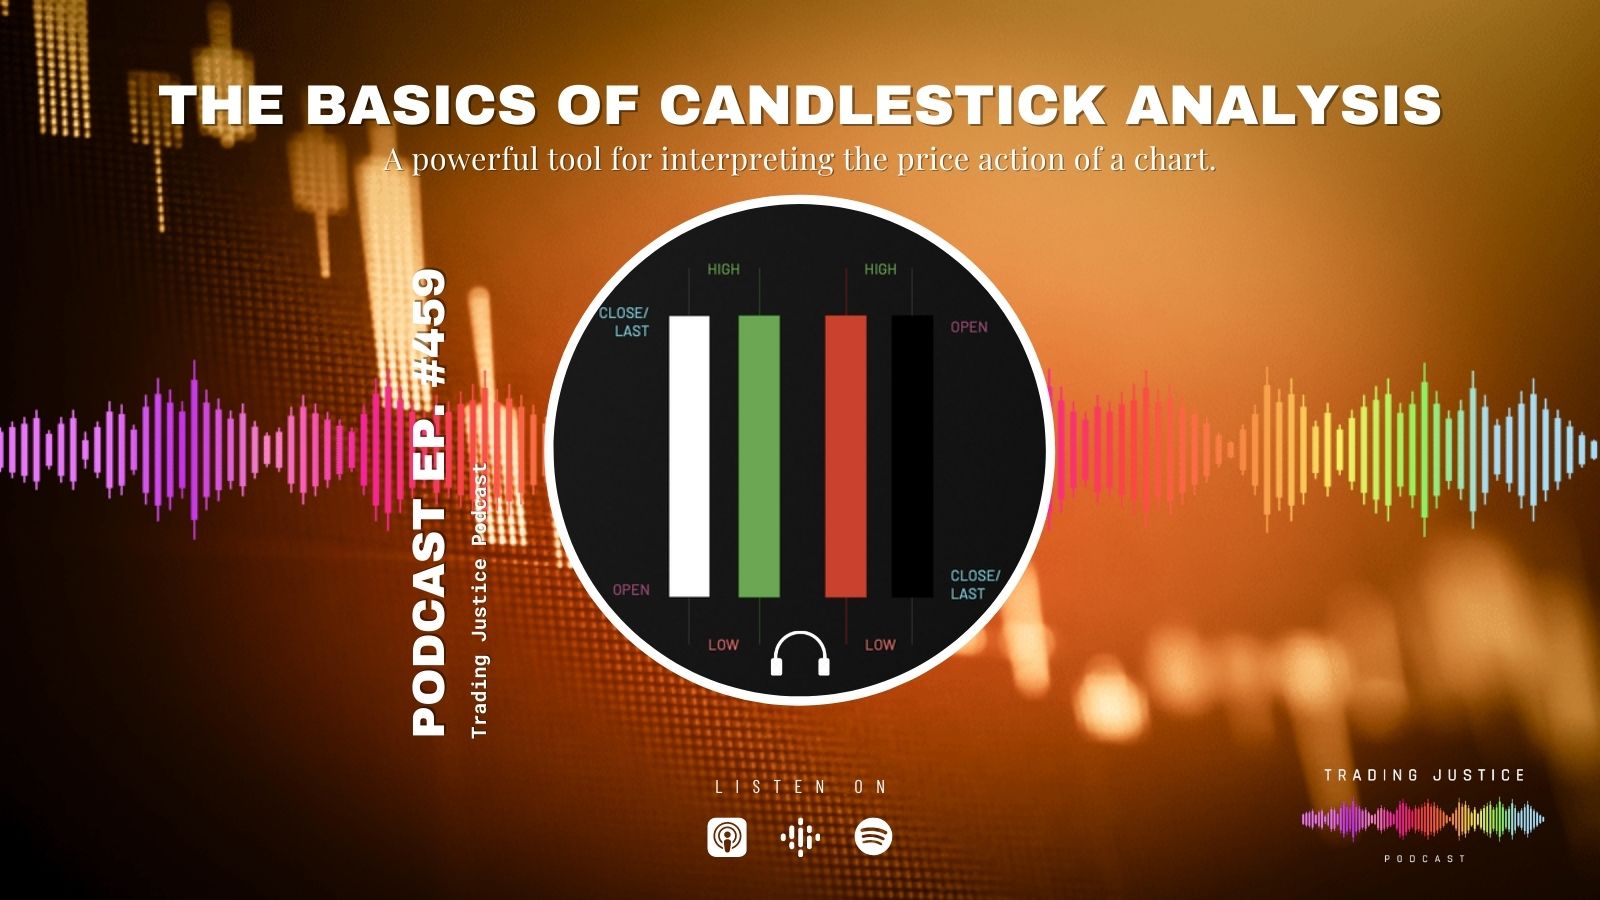
In this episode, Coach Matt and Tim discuss the basics of candlestick analysis in reading charts.
Candlesticks are built through a few simple data points – the open, high, low, and close/last – but are incredibly powerful visually for traders who want to interpret data quickly to make decisions about what is happening in the price action of a chart. Listen in to the coaches discuss candlestick analysis, and how you can use it in your trading.
Before that, Matt and Tim discuss the current news and price action in the marketplace during our weekly skyline. Stocks have been selling the last few days, and are down to start the week. Unclear messaging from the Fed, a rotation into defensive sectors, and the start of earnings season are all impacting markets this week. Listen in to hear our thoughts on the major stories of the week, and what you need to know about their market impact.


