
There are two schools of thought when it comes to finance, in my opinion, and that would be trading and investing. Each one of these terms can conjure up different images in people’s minds. When one hears the word “trader” their mind immediately runs to Wall Street and they start to see these crazy images in their heads of these rogue maverick trader types shouting across the trading pit floors and driving their Lamborghinis down the street at break neck speeds. At least this was in the image I head in my head before I really learned what trading is all about. The reality is very much different and things have changed in the last number of years as the trading pits have all but closed down and computers have essentially taken over.
Then there are the investors. This is usually where someone pulls out a quote they supposedly heard from the likes of Warren Buffett or some off the cuff saying like “BUY LOW SELL HIGH!” There are many facets to the investor type as there are many to the trader type as well.
There are the heavy hitter names in both trading and investing. In trading, you have the likes of Richard Dennis and Paul Tudor Jones. In investing, you’ve got the likes of Warren Buffett or Benjamin Graham. If these names are not familiar to you, then just pound on the google machine for a couple minutes and you will quickly learn more than you probably ever wanted to know about these guys as their popularity in their respective circles in unmatched. One might say that these gentlemen are the “Michael Jordan’s or Lebron James’s” of their respective professions.
These two different factions are not really as unrelated as they may seem and in fact, I would dare to say that they are very similar to one another with the minor exceptions of perspective and timing. The traders tend to usually have a more narrowed time frame and perspective on market activity and the investors’ perspective is typically longer in view with much more patience.
In this month’s newsletter, we are going to delve into that longer term focus that the investors typically have and see how they perceive things a bit differently than those crazy traders! The most glaring difference in perspective for the traders and the investors is the focus on Fundamentals which is what we are going to focus on here as I feel it sums up quickly the differences between these two groups.
Fundamentals, what do we care?

This sounds like a lot of traders I know and if you are looking to get in a trade today and get out by the end of next week then perhaps the Fundamentals don’t really hold that much weight? But what if you subscribe to the Buffett philosophy of “NEVER BUY A COMPANY THAT YOU WOULDN’T WANT TO OWN FOR AT LEAST A DECADE”? Do you think from that perspective that Fundamental might be slightly more important? If we look at the changes from the most recent decade, we can see that there were some significant changes to the investing landscape. For example, the 2008 recession brought down two of the oldest investment banks in existence, namely Lehman Brothers and Bear Sterns. The fundamental perspective of these two companies changed in a big way and had one had the tools and the foresight available one could have seen this change taking place. This is perhaps why one should care because if you are going to hold something for a decade or longer then your investment may be in harm’s way if changes in the investing landscape change. This is not an isolated example, there are many more companies that have gone the way of the dodo bird, that is extinct due to fundamental changes. The first of many examples that come to mind is Blockbuster Video, definitely the dodo bird of Wall Street.
The question that should be popping into your mind if you fancy yourself any type of investor is how can I know if the fundamentals of a company are changing? I’m glad you asked, or rather I’m glad I asked. The process is not as complicated as many might have you believe when you understand what you are looking for. Its similar to taking a road trip, its not hard to get to your destination if you know where you want to go from the outset?
Fundamental Balance

When looking at a company’s fundamentals you need to a find a balance between value and stability. If we are looking at a company that we expect to hold for a decade or more than stability is probably very important but overpaying for stability can also affect the outcome of the investment and can possibly make it not worth owning in the first place. Mr. Buffett has said many times that his investing philosophy is this in a nut shell, “BUY A GREAT BUSINESS AT A FAIR PRICE.” I may be paraphrasing a bit there but I think the message is clear, he looks for quality, stable companies and then looks to buy them at a fair price not necessarily a cheap price. The question that comes to mind is “what is a fair price?” What should we be paying for the great companies?
There are literally hundreds of different metrics one can use to value a company. There are some methods that compare companies of similar nature and see which one has more value. This method of comparing warrants some consideration but does it tell the whole story of the company? Does it give us a picture of where this particular company might be in the future? The reality is that using only one or two metrics is probably not going to get us to the point where we can confidently say that we have a great stable company on our hands and that we are paying a fair price for it. I believe that to get an accurate picture of a company’s health one needs to have a system for evaluating companies and then measure those companies according to those chosen metrics. In this month’s newsletter I am go to demonstrate the metrics I use to determine value and stability and you can then decide if this is a good system for valuation or whether you have your own methods and you can build out your system.
The metrics I use to determine fundamental value, range from the very common to the possibly never heard of before. The metrics have been gathered over a number of years and have been put together in a system-type format and it has proved useful over the years. I will be the first to say that no system is foolproof and neither is this one but I think on the whole it has its merits and can be useful in weeding out candidates that are not making the grade. So, let’s dive in and see which metrics I use, and then there will be a comparison of two similar companies at the end and you can see which one is best from this point of view.
Earnings Per Share (EPS)

This metric on its own is not that useful because different companies have different amounts of outstanding shares and therefore the results can all over the place but it is this metric combined with our second one that gives a reasonable picture of value versus other companies in the same space. EPS is simply the net income or earnings divided by the outstanding number of shares. It is this number that if divided by the price of the shares gives a value that then can measured against companies of a similar nature usually in the same industry. Think Coca-Cola vs Pepsi. This number is called the P/E ratio which is probably the most popular way to see value for most investors. This gives us a clue about value but does little or nothing to tell us about stability, we will get to that in the subsequent metrics.
Price To Earnings Ratio (P/E Ratio)
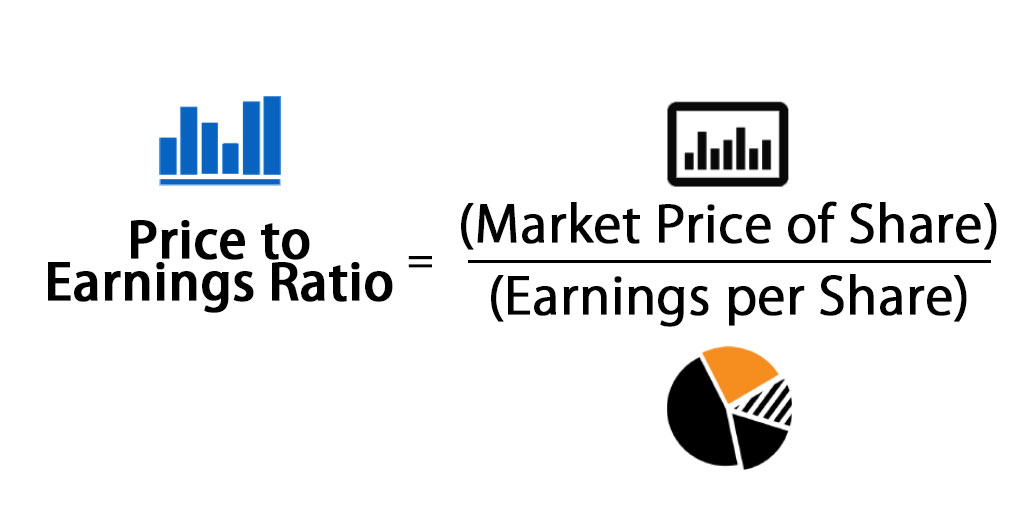
As stated above the P/E ratio is the most popular method for determining value and it is simple to calculate as the formula states. It was the EPS that becomes part of this metric and therefore it was at the top of the list. For all those who not that into doing math the P/E ratio is readily available from almost any financial website. Yahoo finance is a great place to start when looking at fundamental data. You can find the income statement, balance sheet and cash flow statement all under the financials tab. Trading Economics is another place to get any of this data. You will see the end of the newsletter the comparison between two companies and the vast majority of the information can be found at Yahoo Finance. Once we have a relative value to work with, we can start to drill down to see how efficient and stable a business can be to give us a clearer picture of how healthy the business actually is.
The next concept is one that is less widely used but speaks to the efficiency and stability of the business.
Return On Invested Capital (ROIC)
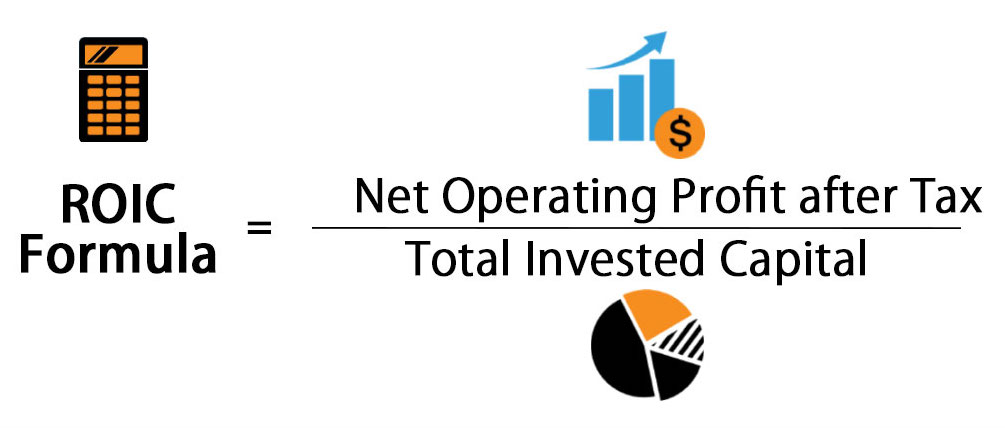
This metric tells us how good the business is at generating profits while keeping capital investment in check. There are businesses like oil and gas exploration companies that are very capital intensive meaning that they have to spend a lot of capital drilling and exploring and this leaves less money for shareholder through the dividends route and also speaks to stability because if you are spending a lot to make a little and you go through some rough times then this could potentially put the company behind the eight ball or so to speak. Ideally, this number should be as high as possible but a good yardstick to measure by is over 20%. Again, all these numbers can be found on Yahoo finance. To figure out the total capital invested is sometimes tough to do because there isn’t a one-line item typically so if we take the long-term debt plus the company’s equity capital then you will have a reasonable number to work with without spending too much time searching for all the parts that would make up that number. The net operating profit after tax is essentially the net income and this can be found in the income statement of Yahoo finance. You will see the numbers and comparison at the end of the newsletter.
The next concept for great companies is do they make big profits on the products they sell? If the profit margins are too thin then as soon as there is a drop in sales even if only temporary then the cashflow stops and can present problems. To ensure this doesn’t happen than a good number to look at is the cash operating margins.
Cash Operating Margins
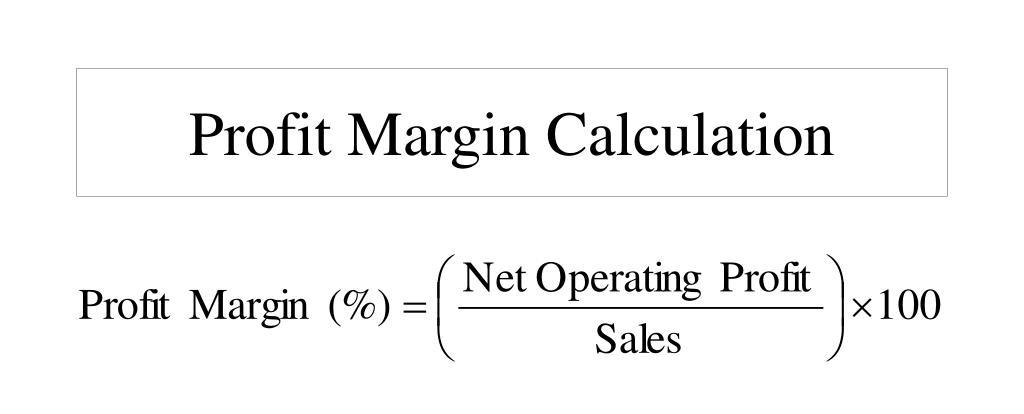
This is an easy metric to come up with as all that is needed is the total cashflow from operating activities which can be found on the cashflow statement of Yahoo finance then divide that number by the total sales and this gives you a percentage of profit margins. Again, the higher this number the better but 20% and above is ideal. This number speaks loudly to efficiency and stability as the higher the profit margins are the more secure the company should be.
These metrics when compared between companies to give a reasonably accurate overall picture of the fundamental health of a given company. This next metric in my opinion is the most important of them all as it is one tangible metric that can’t be faked or manipulated in any way. We are of course talking about Dividends and more importantly dividend history.
Dividends

We have mentioned Warren Buffett in this newsletter several times and why not he is arguably the most successful fundamental investor of our time and therefore his philosophies should be and most likely are universal. This is another one that Buffett takes to heart. I had once heard that Mr. Buffett would not buy a company that does not pay a dividend, now I don’t know that is true for sure but looking at his holdings that seems to be true and why not he understands that great businesses reward their shareholders are a regular basis in the form of dividends. Its really the main reason to own a piece of a business and that is to get paid to hold it. This makes a lot of sense to me. Therefore, I would say that good companies would be able to and do reward their shareholders with dividend payments. I would go further to say the that the higher and more stable a dividend payment is would signal that a business is ultimately doing pretty well. Dividend information is readily available from the business’s website in the investor section or from something like dividend.com. The thing to note about the dividend beside how much they are paying is do they have track record of consistently paying that dividend, if they do then its highly likely that they are making money and doing reasonably well.
When we take into consideration the above five metrics, we can build out a picture and see what it is that we are paying our hard-earned investing dollars for and we can also infer whether that strength is likely to continue into the future or perhaps maybe trouble is brewing. It is unlikely that any company will excel in all these metrics but the good one will be decent in most of these areas.
We are going to do our own Pepsi challenge or so to speak. Instead, we are going to compare the fundamentals of Pepsi and Coke and see which “tastes” better for our investment dollars.

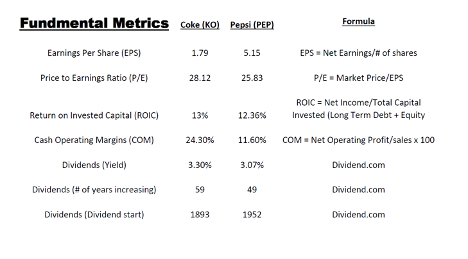
So, we have here our very own Pepsi challenge and the numbers for these two great companies are very interesting. On one hand, you have KO with a bigger dividend yield and a much higher profit margin but in the same vein according to the P/E ratio you are paying a higher price relatively speaking. PEP on the other hand has a quality dividend history with a better P/E ratio relative to KO but the profit margins are considerably lower. The reality is that both of these companies have decent long-term prospects but it could come down to a question of price. PEP is over $130 per share and KO is around $50 per share even though from a P/E standpoint KO is a little more overpriced than PEP at this point.
Summary
The key to using fundamental analysis is to compare companies that are similar in nature and yet meet any criteria you decide is important to determine how well the company is poised now and may be in the future. The best part of having a system of fundamentals to look at is that if you run these metrics on a regular basis and you see the numbers such as ROIC or COM start to worsen then there maybe trouble brewing the company and this can be a heads up to possibly make a change in your portfolio.
At the end of the day looking at fundamentals for companies that one plans to build a portfolio around or keep for extended periods of time is paramount and will go a long way in keeping the investments in the safest manner possible.
