
Like a diamond, the covered call has many facets. And the more you study them, the more beautiful the strategy becomes. I’ve taught and traded the covered call strategy for well over a decade and love to extol its virtues. At the same time, I do acknowledge it has a few flaws. All trading systems do. Regardless, it’s still the most popular options strategy on the Street.
And this month, I’m going to introduce you to it. There will be some math involved, so hold your head still so nothing spills out.
Download the newsletter
Click on the button below to download this month’s newsletter in PDF format:
Basics of Covered Call
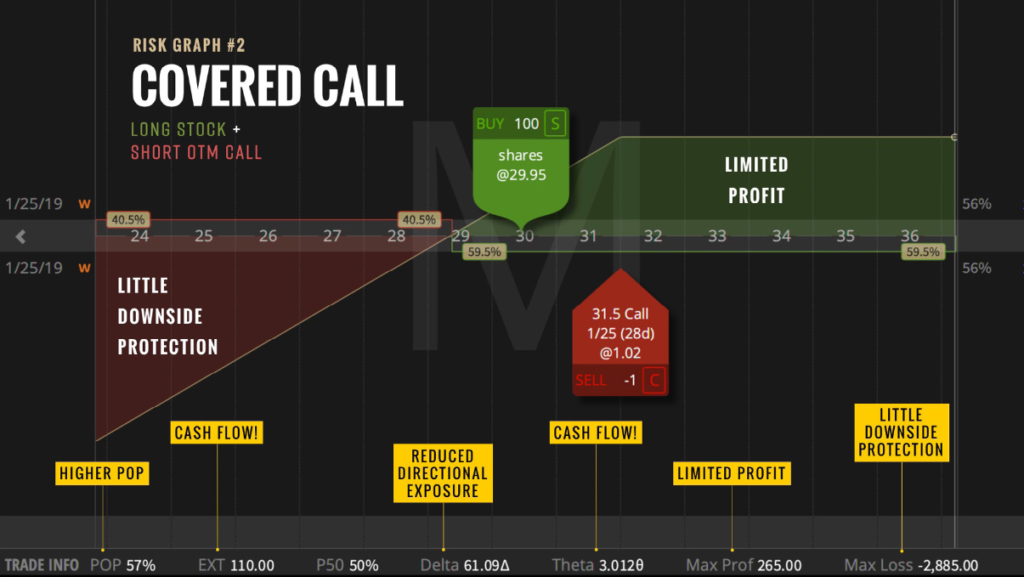
The structure of a covered call is simple. It has two parts. First, you buy 100 shares of stock. Then, you sell one call option. The short call generates the potential for income (or cash flow) and downside protection. It also reduces the volatility you experience throughout the trade while elevating your probability of profit.
In exchange for those four benefits, there is one glaring drawback. You limit your profit potential. This is the big trade-off and illustrates an ever-present reality with trading. You never get something for nothing. Two things should make you feel better about the covered call’s flaw, though. You can decide how quickly you cap the gains, and you can adjust the trade along the way to modify for more bullish markets. Still, we consider the covered call to be a neutral to mildly bullish strategy because of the limited profit.
Let’s look at a basic example.
Step One: Buy 100 shares of stock for $50.
Step Two: Sell one $55-strike call for $2.

Using the accompanying Formula Table, we can calculate the trade metrics for our sample trade.
Cost Basis/Max Risk: $50 – $2 = $48
Cash Flow Expectation: $2
Max Reward: $55 – $48 = $7
The thought process for each number goes something like this.
Cost Basis: The premium received from the call ($2) reduced my overall cost on the position from $50 to $48.
Max Risk: If the stock falls to zero, I will lose the $50 purchase price. But because the call would expire worthless, I will pocket the $2 premium. All-in, my loss would come to $48.
Max Reward: The short call requires me to unload the stock at $55. To discover the max reward is $7, I subtract my original cost basis of $48.
With this detailed case study under our belts, we’re now in a better position to investigate each of the covered call’s advantages.
Cash Flow
Neutral environments are where the cash flow generating powers of the covered call shine. Suppose we have two traders who each own 100 shares of a $50 stock. One of them is a vanilla buy and hold investor. The other sells covered calls to bring in a little coin each month. Over the next year, the stock meanders between $48 and $54, ultimately settling at $50 to end the year unchanged. While the buy and hold investor has nothing to show for the twelve months of time, the covered call investor captured $100 per month, or $1,200 total in call premiums.
That is what we mean by cash flow.
Downside Protection
The premium received from the call acts as a buffer that offsets any loss in the stock. In the $50 stock example above, the $2 of call premium negates up to a $2 loss in the underlying. This is the math behind why covered calls are a less risky position than straight stock. If you want a greater degree of protection, then sell a lower strike price call that offers more premium. Selling at-the-money or in-the-money calls provides more protection than selling out-of-the-money ones.
Volatility Reduction
One of the fastest ways to de-stress your portfolio or a single position is to reduce the amount of exposure. That, in turn, will lower the volatility. Selling calls immediately shrinks the volatility of your stock position. If you want to measure the magnitude of the change, then look at your position’s delta. A 100 share stock position has a +100 delta. If you sell a -30 delta call against it, then you’re effectively lowering your overall volatility by 30%. If you sell a -50 delta call against the stock, then you’re reducing the volatility by 50%.
Here’s how the math works using the -30 delta call example. Suppose the stock price rises $1. The stock part of your position would gain $100. The short call would lose $30. Your total position, then, would increase by $70.
The inverse happens on a down day. A $1 drop in the stock would generate a $100 loss in the stock, but a $30 gain in the short call. In total, your loss would be $70. My favorite way to illustrate the difference between straight stock ownership and a covered call is with an equity curve. Consider the following one, which was first shared in our February newsletter, The Rigors of Risk Management:

The pink line represents a long stock position. The purple line represents what it might look like with a covered call overlay. They both rise over time, but the purple line exhibits less volatility.
Higher Probability of Profit
When you lower the cost basis of a stock position, you simultaneously increase your probability of generating a profit. Usually, when you buy a stock, you only win if it rises in price. But suppose on a $50 stock, I can build a covered call trade with a cost basis of $48. By lowering the effective purchase price, I now score a profit if the stock rises, stagnates, or even falls up to $2.
Because of the many expirations and strikes available, traders have tons of choices when selling a call. Let’s tackle the question of time and strike so you can make a more educated decision.
Which Month Do I Sell?
With the advent of Weeklys options, the choices facing option traders have multiplied ten-fold. But it shouldn’t be overwhelming. All you need to understand are the principles undergirding expiration and strike selection, and your choice should be easy.
Let’s start with the obvious. Covered call sellers focus on using short-term options to maximize time decay. The sweet spot is 30 to 45 days to expiration. Perhaps you’re wondering if it’s better to use Weeklys if they’re available on the stock you own. The answer is yes and no.
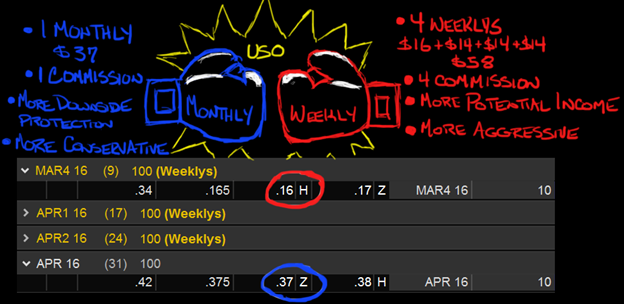
Remember, Wall Street is a world of trade-offs, and nowhere is this more apparent than when trading covered calls. I’ve included four significant comparisons in the accompanying graphic above. I crafted it years ago when Weeklys became available on the United States Oil Fund (USO). At the time, the ETF was trading near $10.
Let’s dig into each.
First, you have the choice of selling one monthly option or four Weeklys over the same time frame. In the picture, I compared selling one April 10 call for 37 cents or four 10 Weeklys calls between now and April, which would generate about 58 cents.
When it comes to income generation, Weeklys have the upper hand. You generate more cash flow by selling four one-week options instead of a single one-month option. But we can’t stop there. How about cost?
If you sell monthly covered calls, you’re essentially paying one commission a month. If you sell four Weeklys, you’re paying four commissions. The transaction cost for the Weeklys route is four times greater. If you’re paying a minimal amount of commission, perhaps this isn’t a big deal. If you’ve yet to get your commission down to around 65 cents a contract, then this could be a big negative associated with Weeklys.
Using monthly options wins the transaction cost contest.
Now, what of protection? Let’s say I sell the April monthly covered call for 37 cents, and you sell the Mar4 weekly for 16 cents. Then USO plummets. Initially, I have more than double the amount of protection as you do. My call premium will offset a 37-cent drop in the stock. Yours will only neutralize a 16-cent drop. Now, sure you can roll to bring in more premium, but so can I. Here’s the bottom line. Traders who short monthly options carry more protection than those with Weeklys.
From a downside protection standpoint, monthly options are superior.
One final comparison of note is liquidity. Monthly options are almost always more liquid. That means the open interest is higher, and the bid-ask spreads are tighter. As a result, the slippage suffered using Weeklys will be worse.
If you’re concerned with liquidity, then you should be using monthly options.
Which Strike Price Should I Sell?
If you own an ETF like the SPY and are selling monthly covered calls, then the only question you really obsess over is strike price selection. Selling lower strike calls affords more income, more protection, but less potential profit (you quickly cut off your upside in the stock). Selling higher strike calls, say, 2% OTM, affords less income, less protection, but more potential profit since you can participate in more upside in the stock before having to part with your shares.
Most traders selling calls will choose which approach appeals to them at the outset and then continue to sell the same strike price month after month. It’s systematic, consistent, and delivers the goodies as promised.
But what if adopting a more adaptive approach could yield better results? What if we modified the threshold instead of selling the same strike every month depending on our directional bias? When more bullish, we could sell 2% OTM calls, when neutral to bearish sell ATM calls.
The data for buying the S&P 500 and selling monthly ATM calls versus selling 2% OTM calls is already available. The CBOE S&P 500 BuyWrite Index (BXM) sells the first call option with a strike above the current SPX price level. It’s basically the ATM option. Here is the performance of BXM (gray) between 2011 and 2016 versus straight buying SPX (yellow):
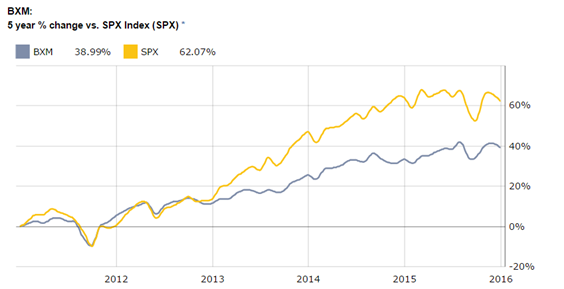
Due to the multi-year bull market carrying stocks to the moon, BXM has underperformed buy and hold by a wide margin. Such is the fate awaiting all covered call sellers during a running of the bulls.
Or is it?
What if we had sold OTM calls instead? For that, I introduce you to the CBOE S&P 500 2% OTM BuyWrite Index (BXY). As the name suggests, it systematically sells calls 2% OTM. And, as mentioned previously, writing OTM covered calls provides less income and protection but more participation in the upside during bull markets. So, for example, with SPY perched at $418, we would sell the 426 strike call (418 x 1.02). Here’s the performance of BXY (gray) versus long SPX (yellow):
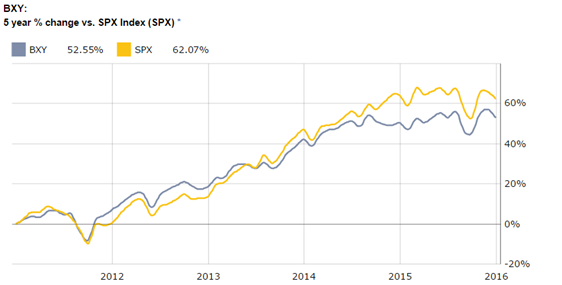
BXY did a much better job keeping pace. And since the SPX tends to climb over time, a side-by-side comparison of BXY vs. BXM reveals the superiority of selling 2% OTM calls.
Some may say the takeaway then is for traders always to take the BXY route. That is, always sell calls that are 2% OTM. But see, I want a better mousetrap. And selling ATM calls is superior in neutral to bearish markets. That’s when BXM offers superior returns.
Here’s an idea you might consider exploring. Adopt an adaptive approach in your covered call selling routine by shorting OTM options when bullish but ATM when neutral to bearish. You don’t have to stick with 2% OTM, though. You might consider a 20 delta or some other metric to select the optimal strike.
The trick is knowing when to switch.
Might there be an easy line in the sand we can use to dictate whether we’re in bull or bear mode?
Of course.
How about a moving average? We’ll want to use a longer-term measurement to minimize whipsaw and jive with the long-term time frame that’s consistent with selling covered calls month after month. The 200-day moving average comes to mind. When the SPY is rising above it, we’re probably in a long-term uptrend suggesting selling an OTM call is the better route. When SPY falls below the 200-day moving average, we could shift tactics and sell the ATM call.
Assuming we don’t get whipsawed too much, the BXM/BXY combo should deliver better risk-adjusted returns than one or the other in isolation.
The Good (and Bad) of the Real Estate Analogy

One of the most famous analogies when explaining covered calls to the layman involves real estate. Selling covered calls is to stock ownership as renting is to house ownership. Say you buy a residential property for $100,000. You can profit from it in one of two ways: price appreciation and rental income. If the house value climbs to $110,000 over the next year, then you’ll rack up a gain of $10k. In an ideal world, housing would rise year after year, adding consistent growth to your net worth.
Of course, you could also rent out the house along the way to pick up additional income. If you could generate $500 in positive cash flow each month, that would add another $6k to your $10k profit, bringing the total to $16k.
The covered call behaves similarly.
Instead of acquiring a home for $100k, suppose you purchased 1,000 shares of a $100 stock. If over the next year it rises to $110, then you would be sitting on a $10k gain.
What if, like the house example, you could rent out your stock?
You can – kind of. This is where the covered call comes in.
Suppose I sold covered calls against my stock position each month and captured $500 in premiums. By the end of the year, that would add another $6k to my bottom line.
Here’s what I like about the analogy. One, it emphasizes the passive, cash flow generating power of the covered call. Two, it pitches the strategy as a complement to stock ownership, not a substitute. If you want to rent out a house, you must first buy the house. If you want to sell covered calls, you must first purchase the stock.
But there’s a wrinkle in the comparison. When you rent out a house you still maintain any potential growth in the home’s value. In contrast, the covered call caps how much upside you can participate in. And when the stock falls, you typically have to keep lowering the cap to maintain the cash flow. In trader-speak, you must keep rolling down your calls to lower strike prices to capture the same amount of income each month. Here’s a second difference. With rental income you never have to give back the rent. With covered calls, you sometimes do have to return the premium. Moreover, you may have to give back more than you originally received. This makes forecasting the potential cash flow stream trickier on the stock side than it may be with real estate.
The devil, as they say, is in the details.
Let’s go back to the original example above where we purchased stock for $50 and sold the $55 call option for $2. Suppose the stock rises to $59, and we decide we don’t want to let our shares get called away at $55. To avoid assignment, you would have to buy back the call. If you did so before expiration, it might have cost upwards of $5.
Think about the cash flow from the call. $2 came in at trade inception, and $5 went out at trade exit. For that month, selling covered calls hurt your bottom line. Not only did you not capture $2 in cash flow, but you also lost $3.
Covered call proponents will quickly point out that while you lost $3 on the call, you built an unrealized gain of $9 on the stock ($59-$50). Thus, overall, you still profited. They are correct. But they miss my point. This outcome never really happens in real estate. Therefore, it’s an imperfect comparison that trips people up if they cling too strictly to the real estate analogy.
Top Seven Reasons to Add Covered Calls to your Portfolio
To round out the newsletter and make sure nothing was lost in the shuffle, let’s conclude with seven standout reasons why you should mix covered calls into your account.
1. They increase your probability of profit.
2. They provide a modicum of downside protection.
3. They allow you to defend a struggling stock position.
4. They reduce the volatility of stock investing.
5. They have the potential to generate monthly cash flow.
6. They are a gateway strategy into the wonderful world of options trading.
7. They introduce you to the powerful concept of hedging.
Legal Disclaimer
Trading Justice LLC (“Trading Justice”) is providing this website and any related materials, including newsletters, blog posts, videos, social media postings and any other communications (collectively, the “Materials”) on an “as-is” basis. This means that although Trading Justice strives to make the information accurate, thorough and current, neither Trading Justice nor the author(s) of the Materials or the moderators guarantee or warrant the Materials or accept liability for any damage, loss or expense arising from the use of the Materials, whether based in tort, contract, or otherwise. Tackle Trading is providing the Materials for educational purposes only. We are not providing legal, accounting, or financial advisory services, and this is not a solicitation or recommendation to buy or sell any stocks, options, or other financial instruments or investments. Examples that address specific assets, stocks, options or other financial instrument transactions are for illustrative purposes only and are not intended to represent specific trades or transactions that we have conducted. In fact, for the purpose of illustration, we may use examples that are different from or contrary to transactions we have conducted or positions we hold. Furthermore, this website and any information or training herein are not intended as a solicitation for any future relationship, business or otherwise, between the users and the moderators. No express or implied warranties are being made with respect to these services and products. By using the Materials, each user agrees to indemnify and hold Trading Justice harmless from all losses, expenses, and costs, including reasonable attorneys’ fees, arising out of or resulting from user’s use of the Materials. In no event shall Tackle Trading or the author(s) or moderators be liable for any direct, special, consequential or incidental damages arising out of or related to the Materials. If this limitation on damages is not enforceable in some states, the total amount of Trading Justice’s liability to the user or others shall not exceed the amount paid by the user for such Materials.
All investing and trading in the securities market involve a high degree of risk. Any decisions to place trades in the financial markets, including trading in stocks, options or other financial instruments, is a personal decision that should only be made after conducting thorough independent research, including a personal risk and financial assessment, and prior consultation with the user’s investment, legal, tax, and accounting advisers, to determine whether such trading or investment is appropriate for that user.
