
“Portfolio Design, Position Sizing, and Risk-Reward.
Master the Holy Trinity of Trading and you shall succeed.”
— Tackle daily email: January 9th, 2019 —
And here we are: The Holy Trinity of Trading Part III: Risk-Reward Ratio, the third and last part of the series.
As you’ve already guessed, the whole argument that’s being consistently preambled throughout the series is still valid: It is not our intention to develop the ultimate opus or the definitive guide to these complex subjects, but modestly contribute to the eternal search for the Holy Grail of Investing: how successful traders and investors are born.
Here’s the fully covered Holy Trinity of Trading roadmap:
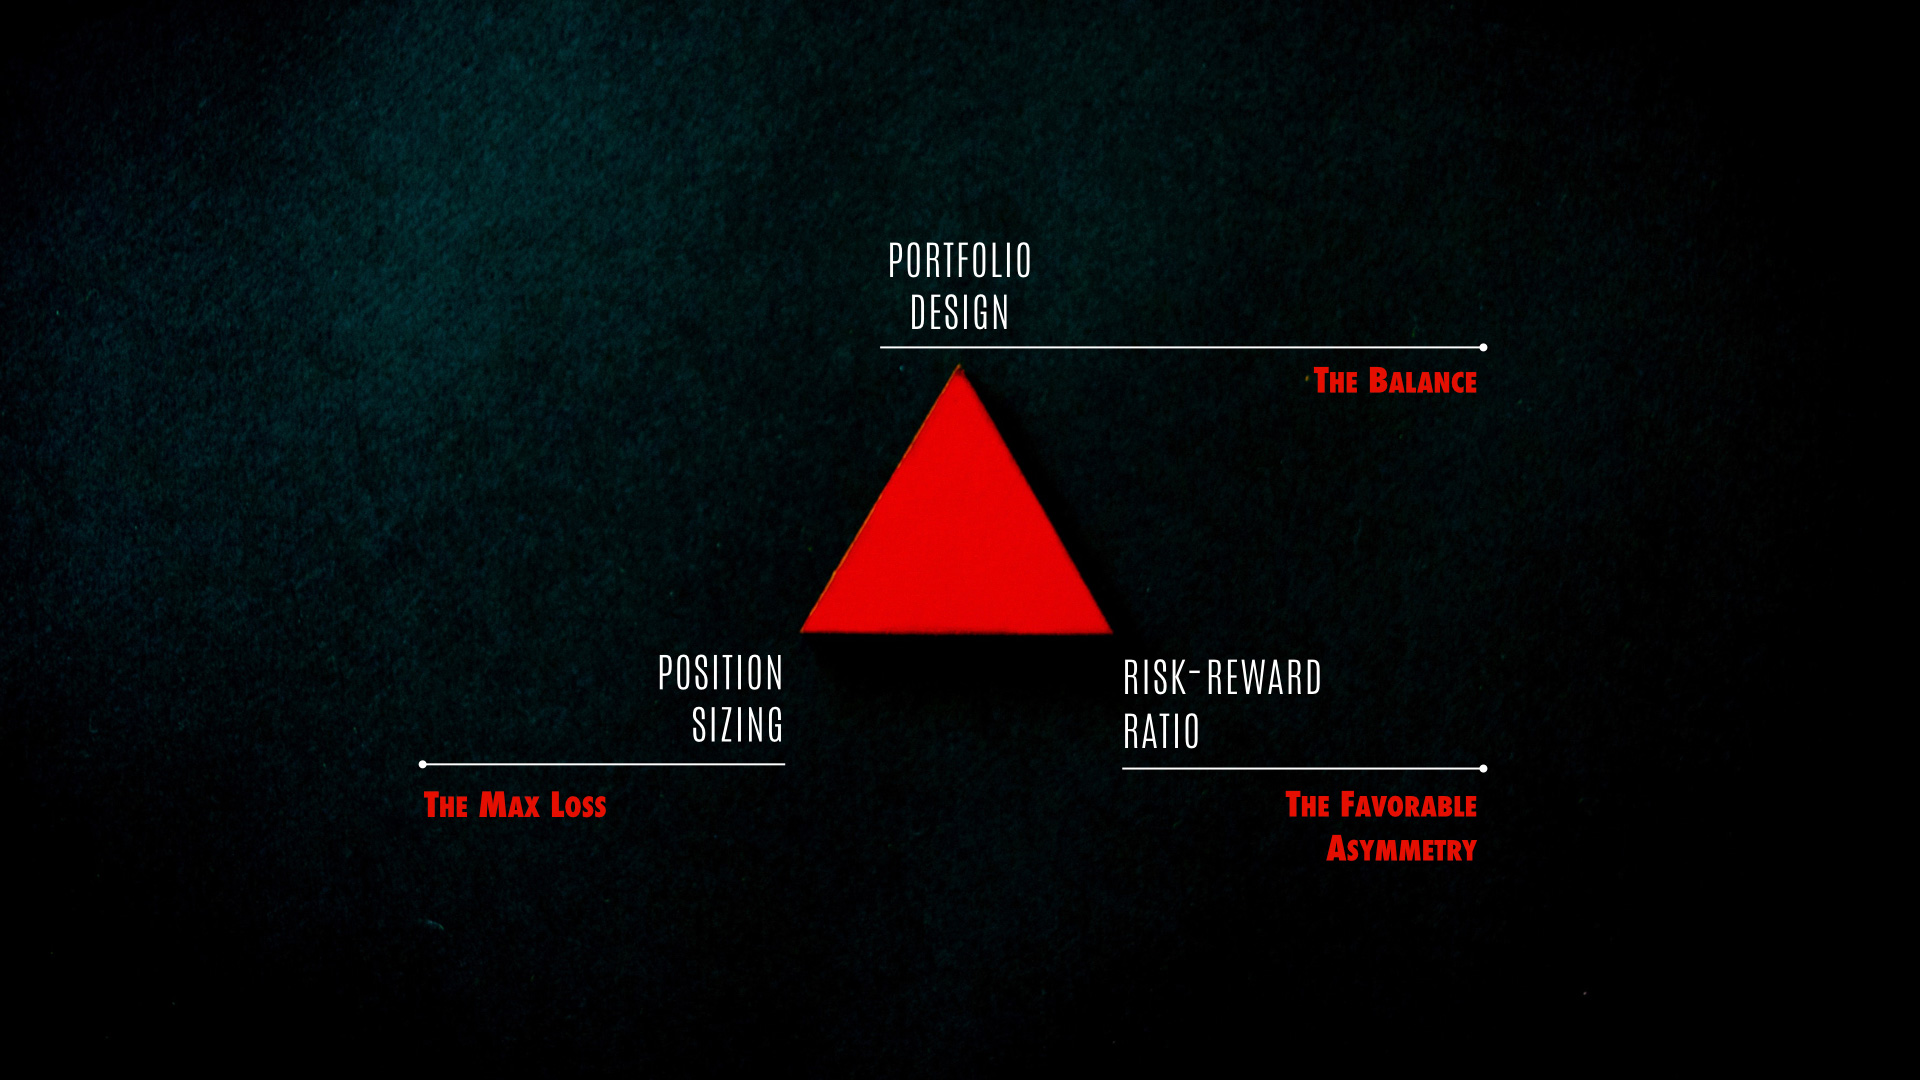
Portfolio Design represents the balance inside the Trinity. This is the topic we’ll be discussing in this edition (February 2019). CHECK ✅
Position Sizing (also called Money Management) represents the max loss inside the Trinity. This topic will be discussed in the March 2019 edition. CHECK ✅
Risk-Reward Ratio (also called Reward to Risk Ratio) represents the favorable asymmetry inside the Trinity and was reserved for this edition. YOU ARE HERE 📍

In the last two editions, we’ve mentioned that if you search for Holy Trinity on the internet you will find quite an impressive number of resources, ranging from religious texts to the Matrix (which, by the way, is about to turn 20), from marketing to investing. Nothing has changed ever since. We didn’t change either and the Trading Justice version of the Holy Trinity is still intact:
Potato, Potahto
You like potato and I like potahto
You like tomato and I like tomahto
Potato, potahto, tomato, tomahto
Let’s call the whole thing off
In the last edition, we’ve talked about Position Sizing (Money Management). That is your risk. Where’s the reward?
Risk and Reward are a duo, just like Chaos & Order, Ella & Satchmo, Salmonella & Egg Yolk, Dirt & Fingernails. In this particular case, Risk and Reward—henceforth referred to as R:R—have a single mission: make your trading business profitable in the long run. Doesn’t matter if one says potato and the other potahto they must balance each other out. In the financial markets, we can be wrong but we can also be right. So how does that relationship go?
Incompatibility is not the answer.

Down & Dirty
I hate reality but it’s still the best place to get a good steak.
Woody Allen
The world is a harsh place to live in. Nature is constantly trying to kill us all and she will succeed in the end, mind you. Compensating for all the hassle, at least we can get a good steak.
By exercising the full potential of the being, humans materialize things. We have this innate ability to make tangible things that once were intangible; visible from the invisible. We’ve then created the financial markets Nature’s image. Savage. Down and dirty. A place where creatures from the abyss are bred and meteorites from the sky abound.
That is why we won’t bother you with philosophy. We will give you the steaks you deserve.

Steak #1: The classical definition
How much money do you make for every dollar you risk?
That’s pretty much it. A succulent steak with the bare minimum, salt & pepper.
However, if you are the type of trader that gets irritated by the simple things in life, here’s the gourmet version from Investopedia:
Many investors use a risk/reward ratio to compare the expected returns of an investment with the amount of risk they must undertake to earn these returns. Traders often use this approach to plan which trades to take, and the ratio is calculated by dividing the amount a trader stands to lose if the price of an asset moves in an unexpected direction (the risk) by the amount of profit the trader expects to have made when the position is closed (the reward).
Now we happy.
The bad news is that just like in Portfolio Design (Feb 2019 edition) and Position Sizing (Mar 2019 edition), there isn’t a magical number, a one-size-fits-all-you-are-good-to-go type of figure. It all depends on how much risk you can stomach for every dollar you invest to reach the coveted ROI. The best way to go, especially if you are brand new, is to sit down with a Mentor and design the R:R parameters that fit your style of trading.

Steak #2: Size doesn’t matter
No, you are not in Sue Johanson’ TV show.
One thing you will eventually notice while in the path of becoming a successful trader is that size really doesn’t matter that much in the realms of R:R. To make this point clear, we are going to present two case studies further on in this article. One of them is from Tackle Trading’s famous weekly Scouting Reports and the other is from the Cash Flow Condors premium system. One has a juicy steak, beautiful R:R figure. The other has an inverse R:R.
The Scouting Report case reveals an R:R of 1:6.5 for the first target and an R:R of 1:14 for the second target. What that means is that for each dollar you’ve risked you would’ve made $6.5, in case of the first target, and $14 in case of the second target.
The Cash Flow Condors case has an R:R of 9:1, meaning that if things go sideways, your potential loss is nine times the potential reward.
I can notice your eyes protruding in astonishment while you grab some garlic to avoid the Condors trade. Not so fast.
1:6.5
1:14
9:1
Obviously, the higher you get the potential reward in relation to the risk of a loss, the better. However, you can still be profitable even on an inverse R:R. Yes, you can.
You are going to see for yourself that these are all numbers without context. They look promising but mean nothing until we instill them life.
Steak #3: R:R vs. POP
Traders deal with the POP every single day, especially Options traders.
POP stands for Probability of Profit. Basically, it refers to the chance of making at least $0.01 on a trade. No one wants to make a miserable $0.01 on a position but that’s the classic definition.
Would you like to get into a position with a 14% POP?
Would you like to get into a position where the risk is 9 times the reward?
You’re probably going to answer NO to both questions but hold on. Don’t answer now.
There is no need for you to calculate the POP for each trade as most platforms will automatically give you this number. What we need you to focus on is that, just as gravity bends time and space, so does POP bend the R:R perception. Take a look at this picture:
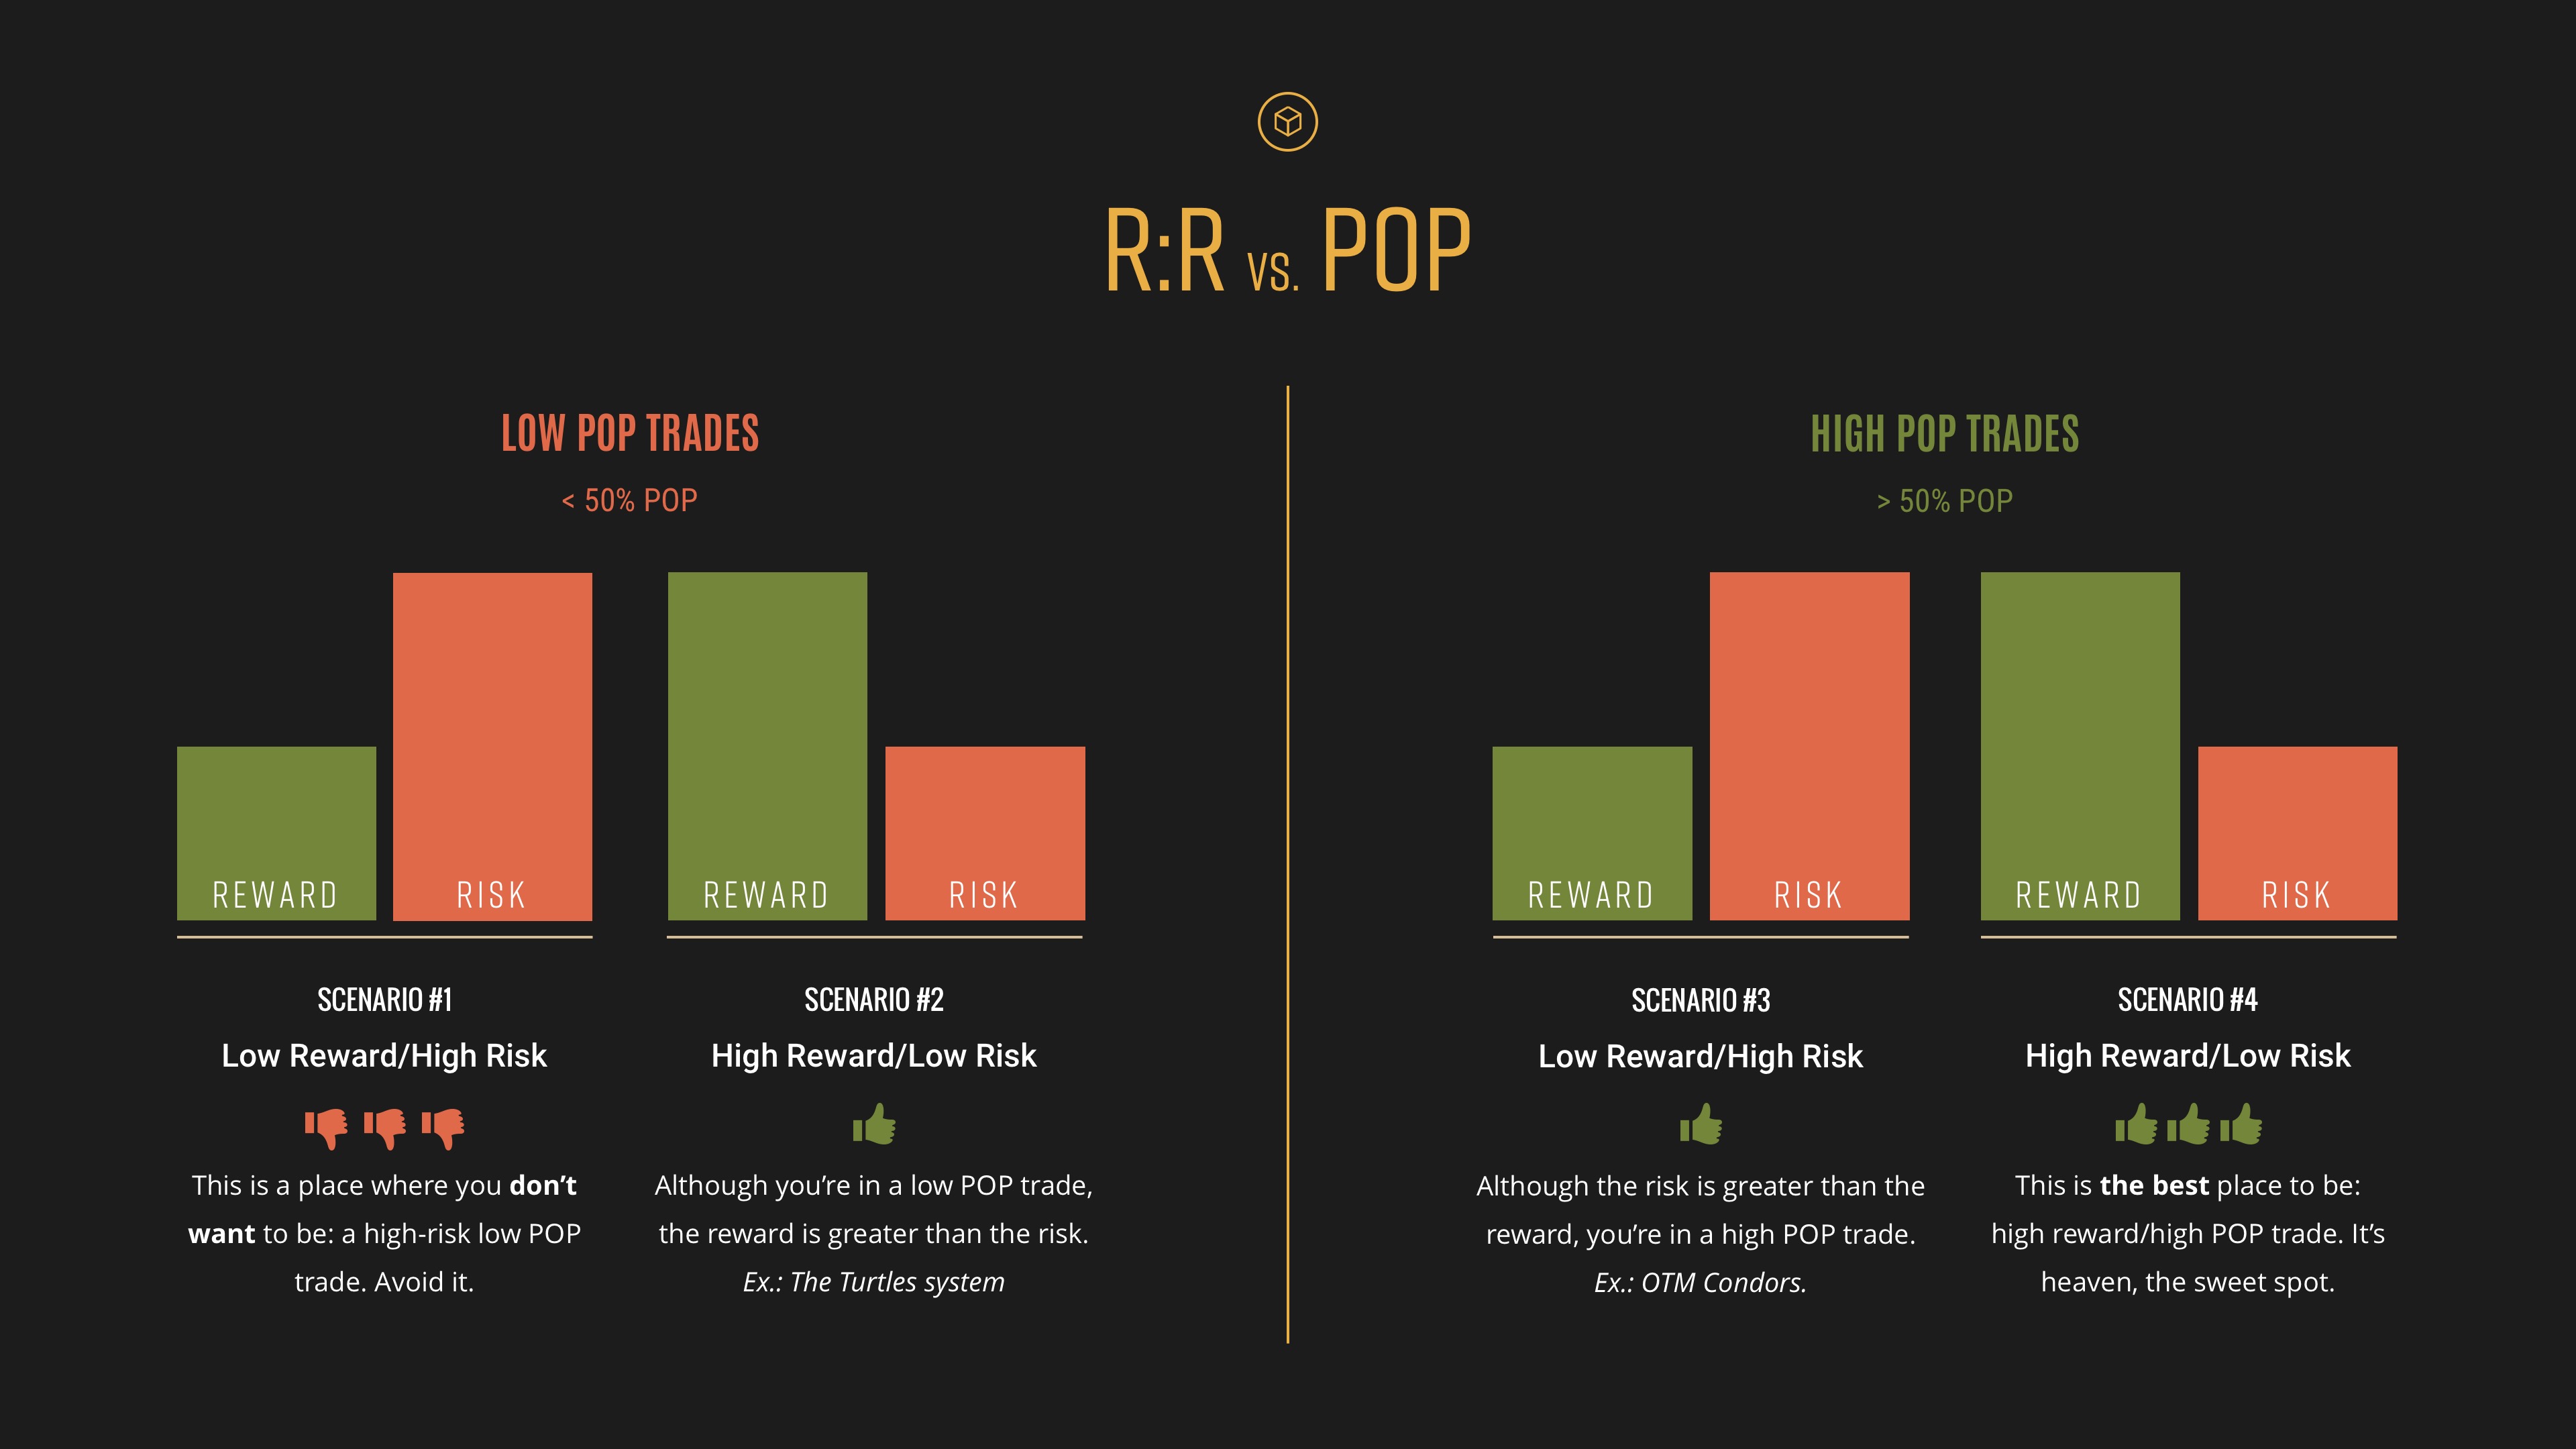
The infographic above depicts how POP can bend the R:R perception. Considering that a low POP trade is one that has less than a 50% chance of making at least $0.01 and a high POP trade is one that, conversely, has a greater than 50% chance of making at least $0.01, here’s how it works.
In scenario #1 there is hell. High risk, low reward in a low POP environment. In other words, a position where nothing is working in your favor. There’s too much risk and a low probability that the reward will materialize. We strongly recommend you shy away from this place.
Scenario #2 shows us the mythical Turtles system. If you recall the “1998 Cocoa Breakout” case from the last edition, you will see some resemblance. A low POP trade (≈14% chance of success) with a healthy R:R, averaging 1:21. Although Curtis Faith took a loss on 24 out of 28 trades, the R:R was working in his favor: for every dollar risked, a $21-dollar reward, on average. Not only that, but his money management was surgical.
Scenario #3 shows us a typical Iron Condor trade, like our premium system Cash Flow Condors. The R:R is inverse, generally 9:1, which would give the impression that such a trade cannot be touched in any circumstances. That’s just not the case due to the system’s extremely high POP (82 ‹› 85%).
Scenario #4 is the Empyrean, the highest Heaven, the place where Dante meets Beatrice in Canto XXX. The reward is greater than the risk in a high POP environment. Kudos to you if you trade within a system like that.
Now, back to the questions posed at the beginning:
Would you like to get into a position with a 14% POP?
Would you like to get into a position where the risk is 9 times the reward?
If you changed your answer from NO to YES, proceed.

Steak #4: R:R vs. Expectancy
In trading, expectancy is a simple calculation that shows what the typical profit is for each trade placed. Just as the POP, expectancy can also bend the R:R perception. Here’s the mojo:
E = [1 + (W/L)] * P - 1
The variables are:
E is the expectancy.
W is the size of your average win.
L is the size of your average loss.
P is the win ratio.
Let’s say you made 10 trades. From the total, 6 were winners and 4 were losers. Let’s calculate P, the win ratio:
P = 6/10 = 0.6
Say the 6 winners made you $3,000 profit. Let’s calculate W, the size of your average win:
W = 3000/6 = 500
Say the 4 losers brought you a total $1,600 loss. Let’s calculate L, the size of your average loss:
L = 1600/4 = 400
Now, applying those numbers to the expectancy formula we have:
E = [1 + (500/400)] * 0.6 - 1 = 0.35
The expectancy is positive, although the R:R is almost 1:1. The result shows that you can expect to make $0.35 for every dollar invested in the long run.

Steak #5: Free as a bird
We’ve discussed asymmetry on the last edition when talking about Money Management. The subject becomes pertinent once again.
Asymmetry is, in its simplest form, the lack of symmetry. Some professions require symmetry, either structural or aesthetical. Others not only can live without symmetry but are in constant search of a good one. Like us, traders.
Now that you are acquainted with the relativeness of the R:R—as its very perception can be bent by POP and expectancy—, feel deeply in your heart that you are completely free to choose the asymmetry you want.
If you choose to lose small when things go weary and win big when things go your way, good, as long as the POP and the expectancy are working in your favor.
If you choose to lose big when things go sideways and win small when skies are blue, perfect, as long as the POP and the expectancy are working in your favor.
Enough of steaks, barbecue is over. On with the pragmatism.

Getting pragmatic: Exit before entering
Risk needs a stop. Reward needs a target. Both are exit orders and need to be set BEFORE you enter any trade. In case you’re a new trader, sit down with your Mentor to discuss the numbers.
The plan is very simple, in fact, as simple as a list like the following one:
My instructions to enter a position are:
- ______________________
- ______________________
My instructions to exit a position for a PROFIT are:
- ______________________
- ______________________
My instructions to exit a position for a LOSS are:
- ___________________________
- ___________________________
Getting pragmatic: The R:R Batch
In our System Development 101 video series, we’ve taught our students how to qualify trades before pulling the trigger. What that means is once traders got the list of candidates to trade, they’ll be running some numbers that will lead to a binomial result: they will or they won’t trade the candidates based on the analysis outcome. No middle term. Diligence, consistency, and organization are key at this moment.
In this phase, traders run three batches of numbers to qualify the trade and make the decision. The first batch—Position Sizing—was presented in the last edition. The second batch is the R:R.
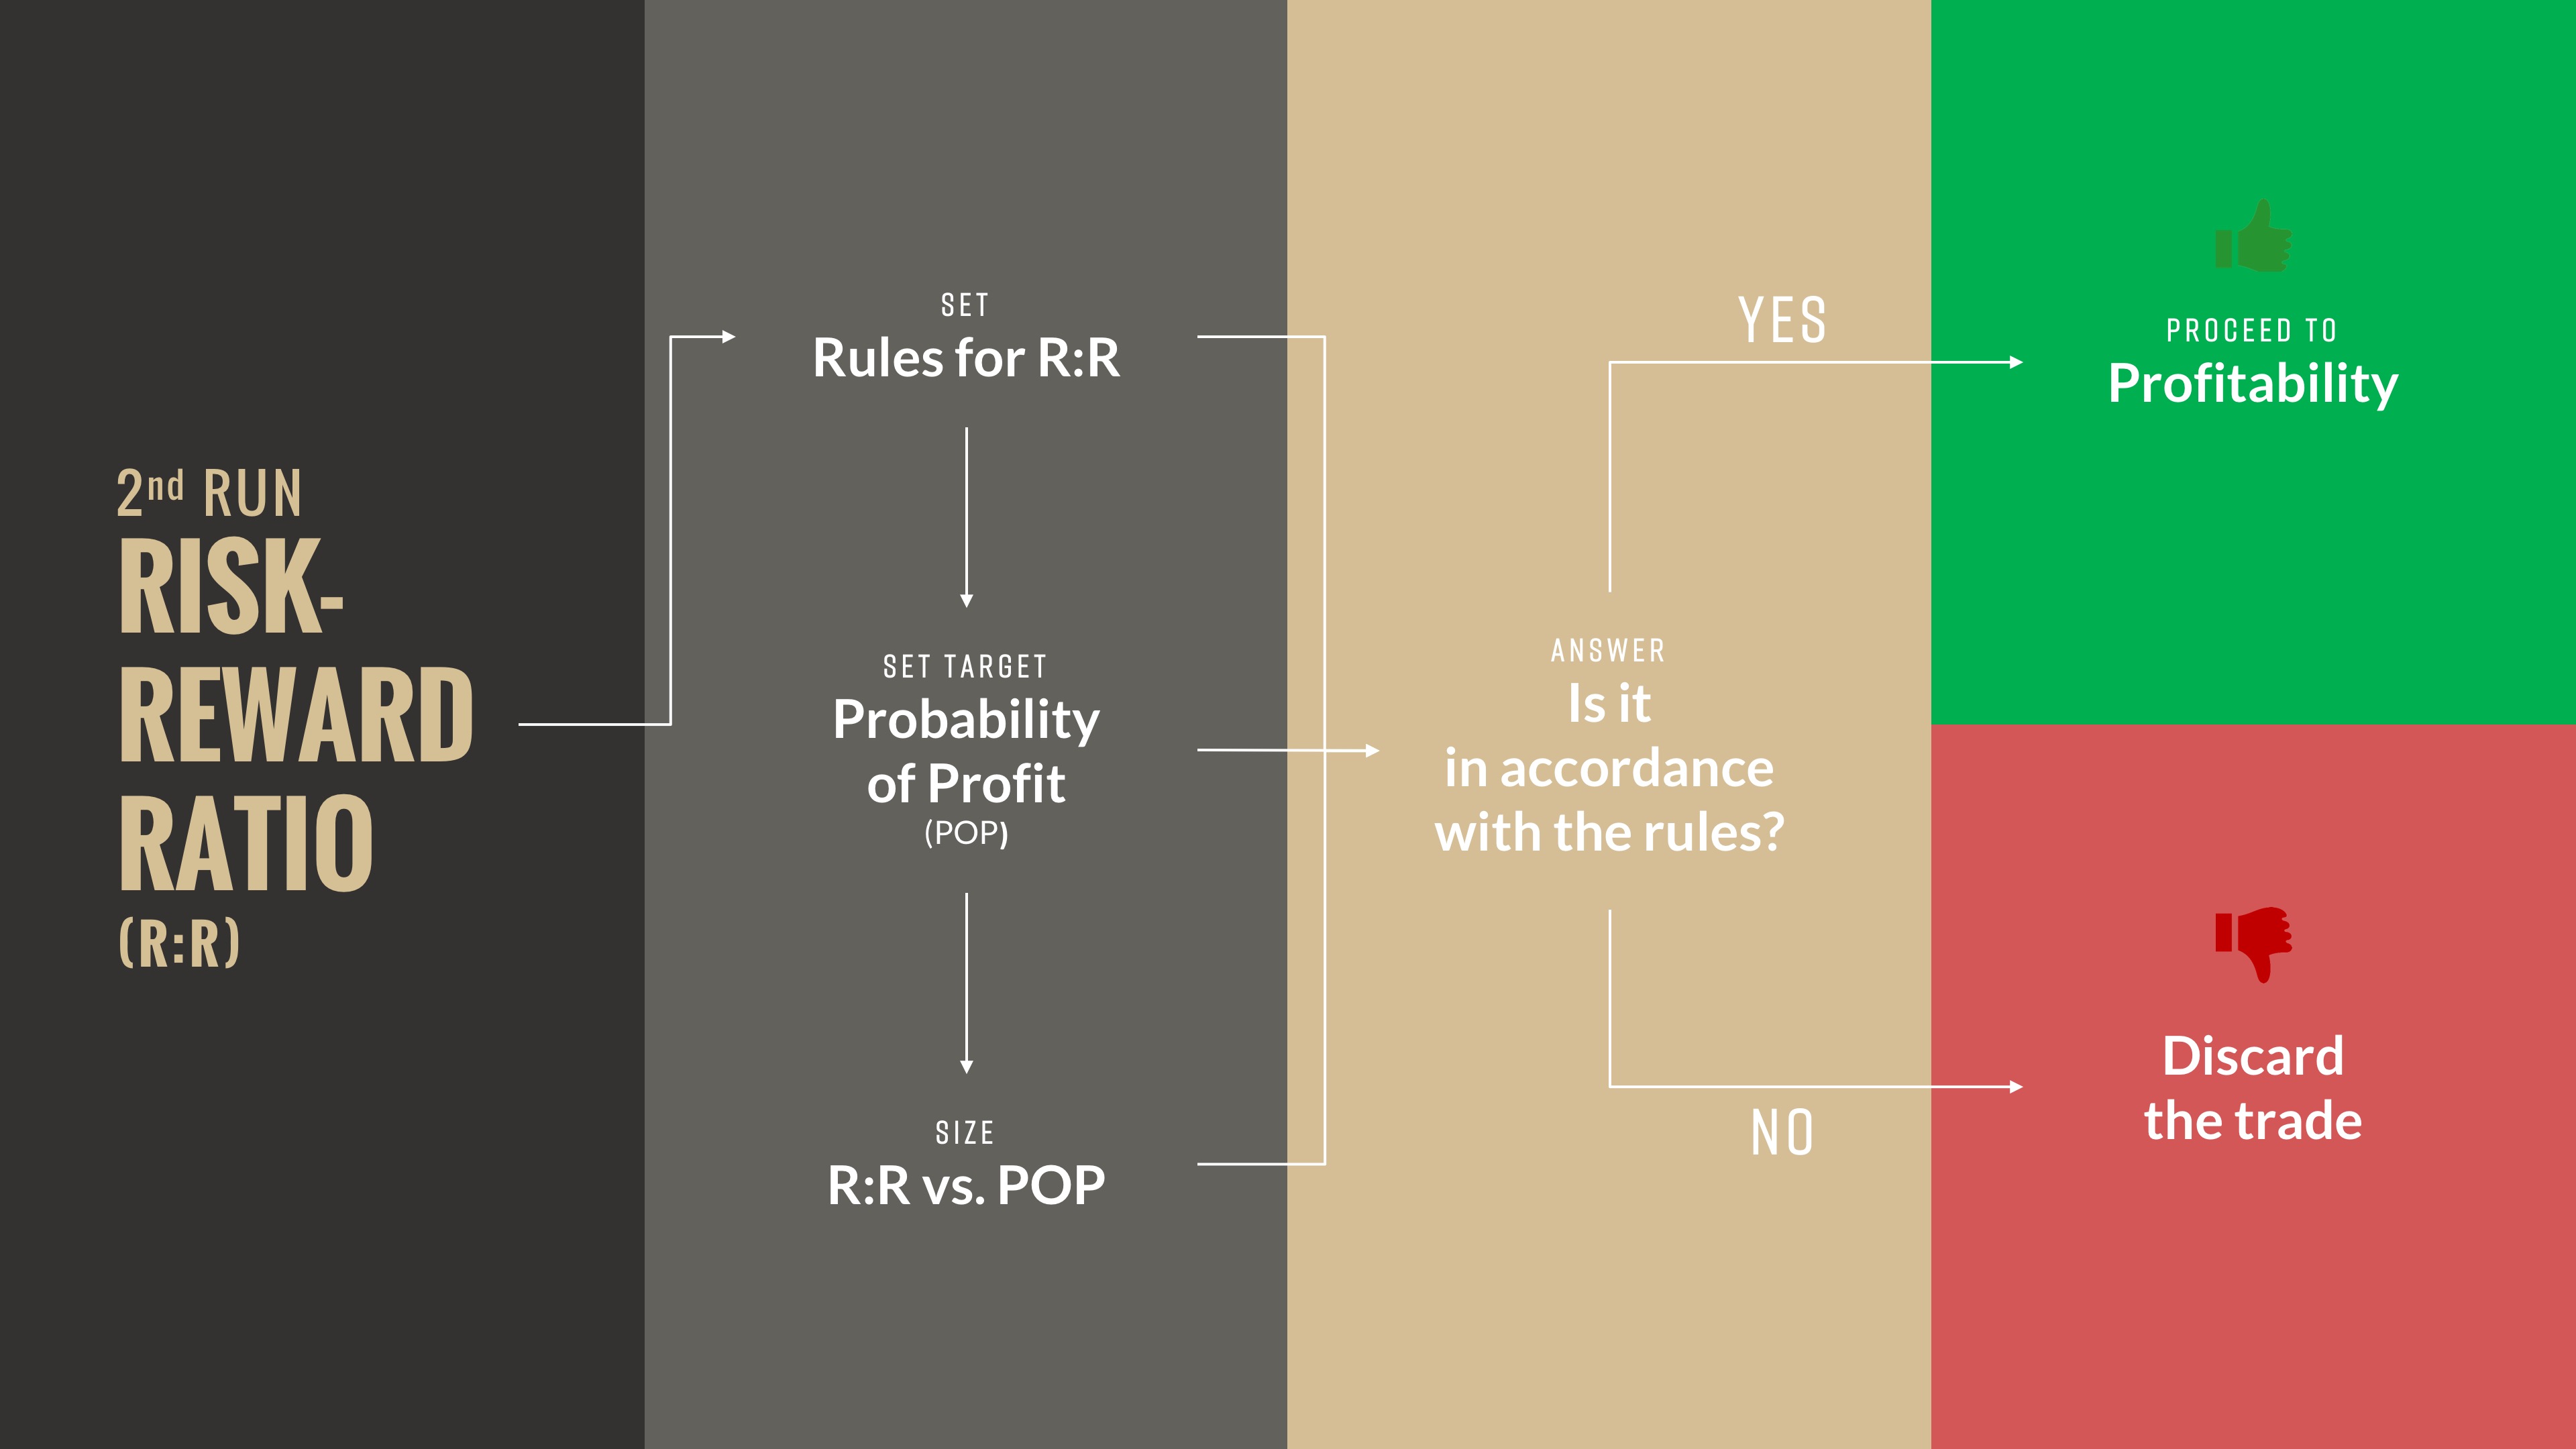
This infographic extracted from the training series represents the Risk-Reward Ratio workflow. First, you set the R:R rules. Second, you set the POP. Next, you size the R:R against the POP (read Steak #3: R:R vs. POP if you need). If everything is in accordance with the rules proceed to the next step (in the case of Systems 101 course, it’s the Profitability).

Getting pragmatic: The Goldman Sachs case
Typically, directional trades belong to the domains of the low POP as they have roughly a 50% chance of being profitable. “Well, if they have a low probability of being successful, then I have to make the R:R work in my favor.”. That’s the mindset.
Every week we publish the famous Scouting Reports. For those who don’t know, they provide up to date information and watchlist candidates that are compatible with current market conditions. Our team of coaches puts together potential trade setups and market analysis across the world of stocks, options, and forex. The reports are primarily swing trading reports.
On the Options Report from December 1st, 2018, we had Goldman Sachs (NYSE: GS) as a bearish pick. Here’s the case.
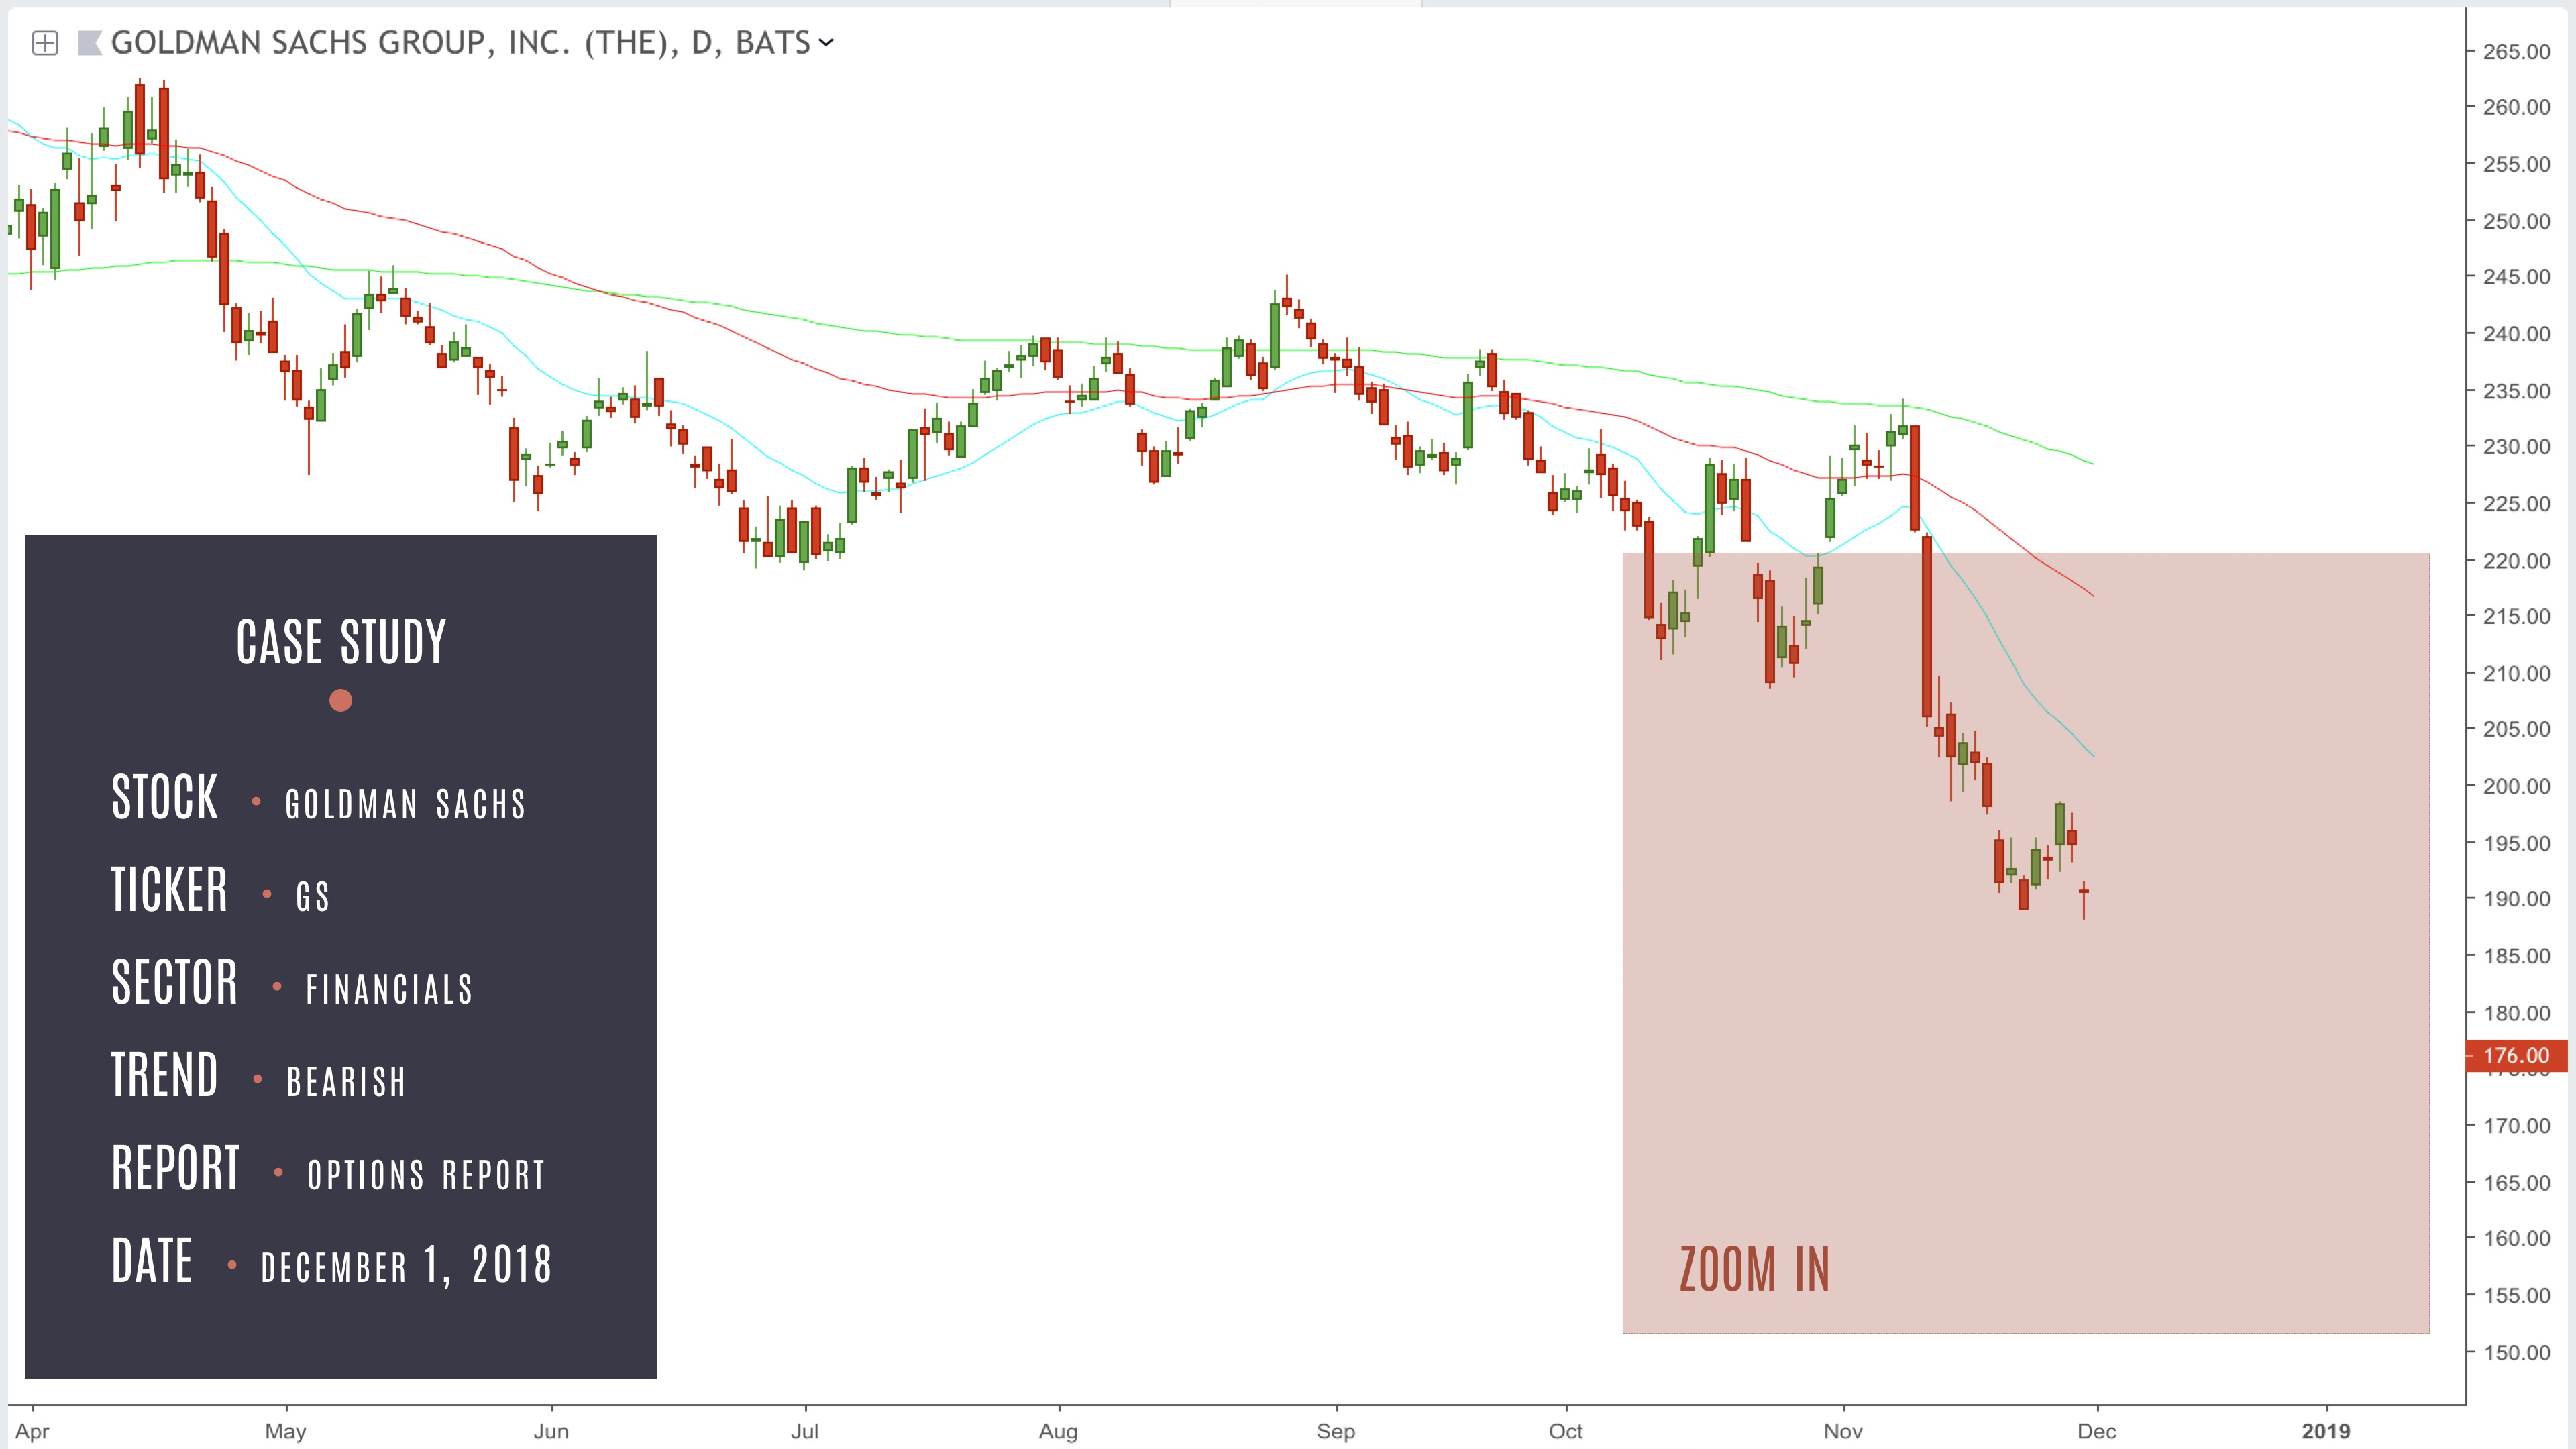
One can argue that due to the technical set up, we can skew the POP to something a little bit higher than 50%. For the case of simplicity, we won’t do that. About 50% sounds right, meaning that the trend can continue the path of the bears and make you some money or go in the opposite direction, leaving you with a loss. Here’s how the trade proceeded in the following weeks.
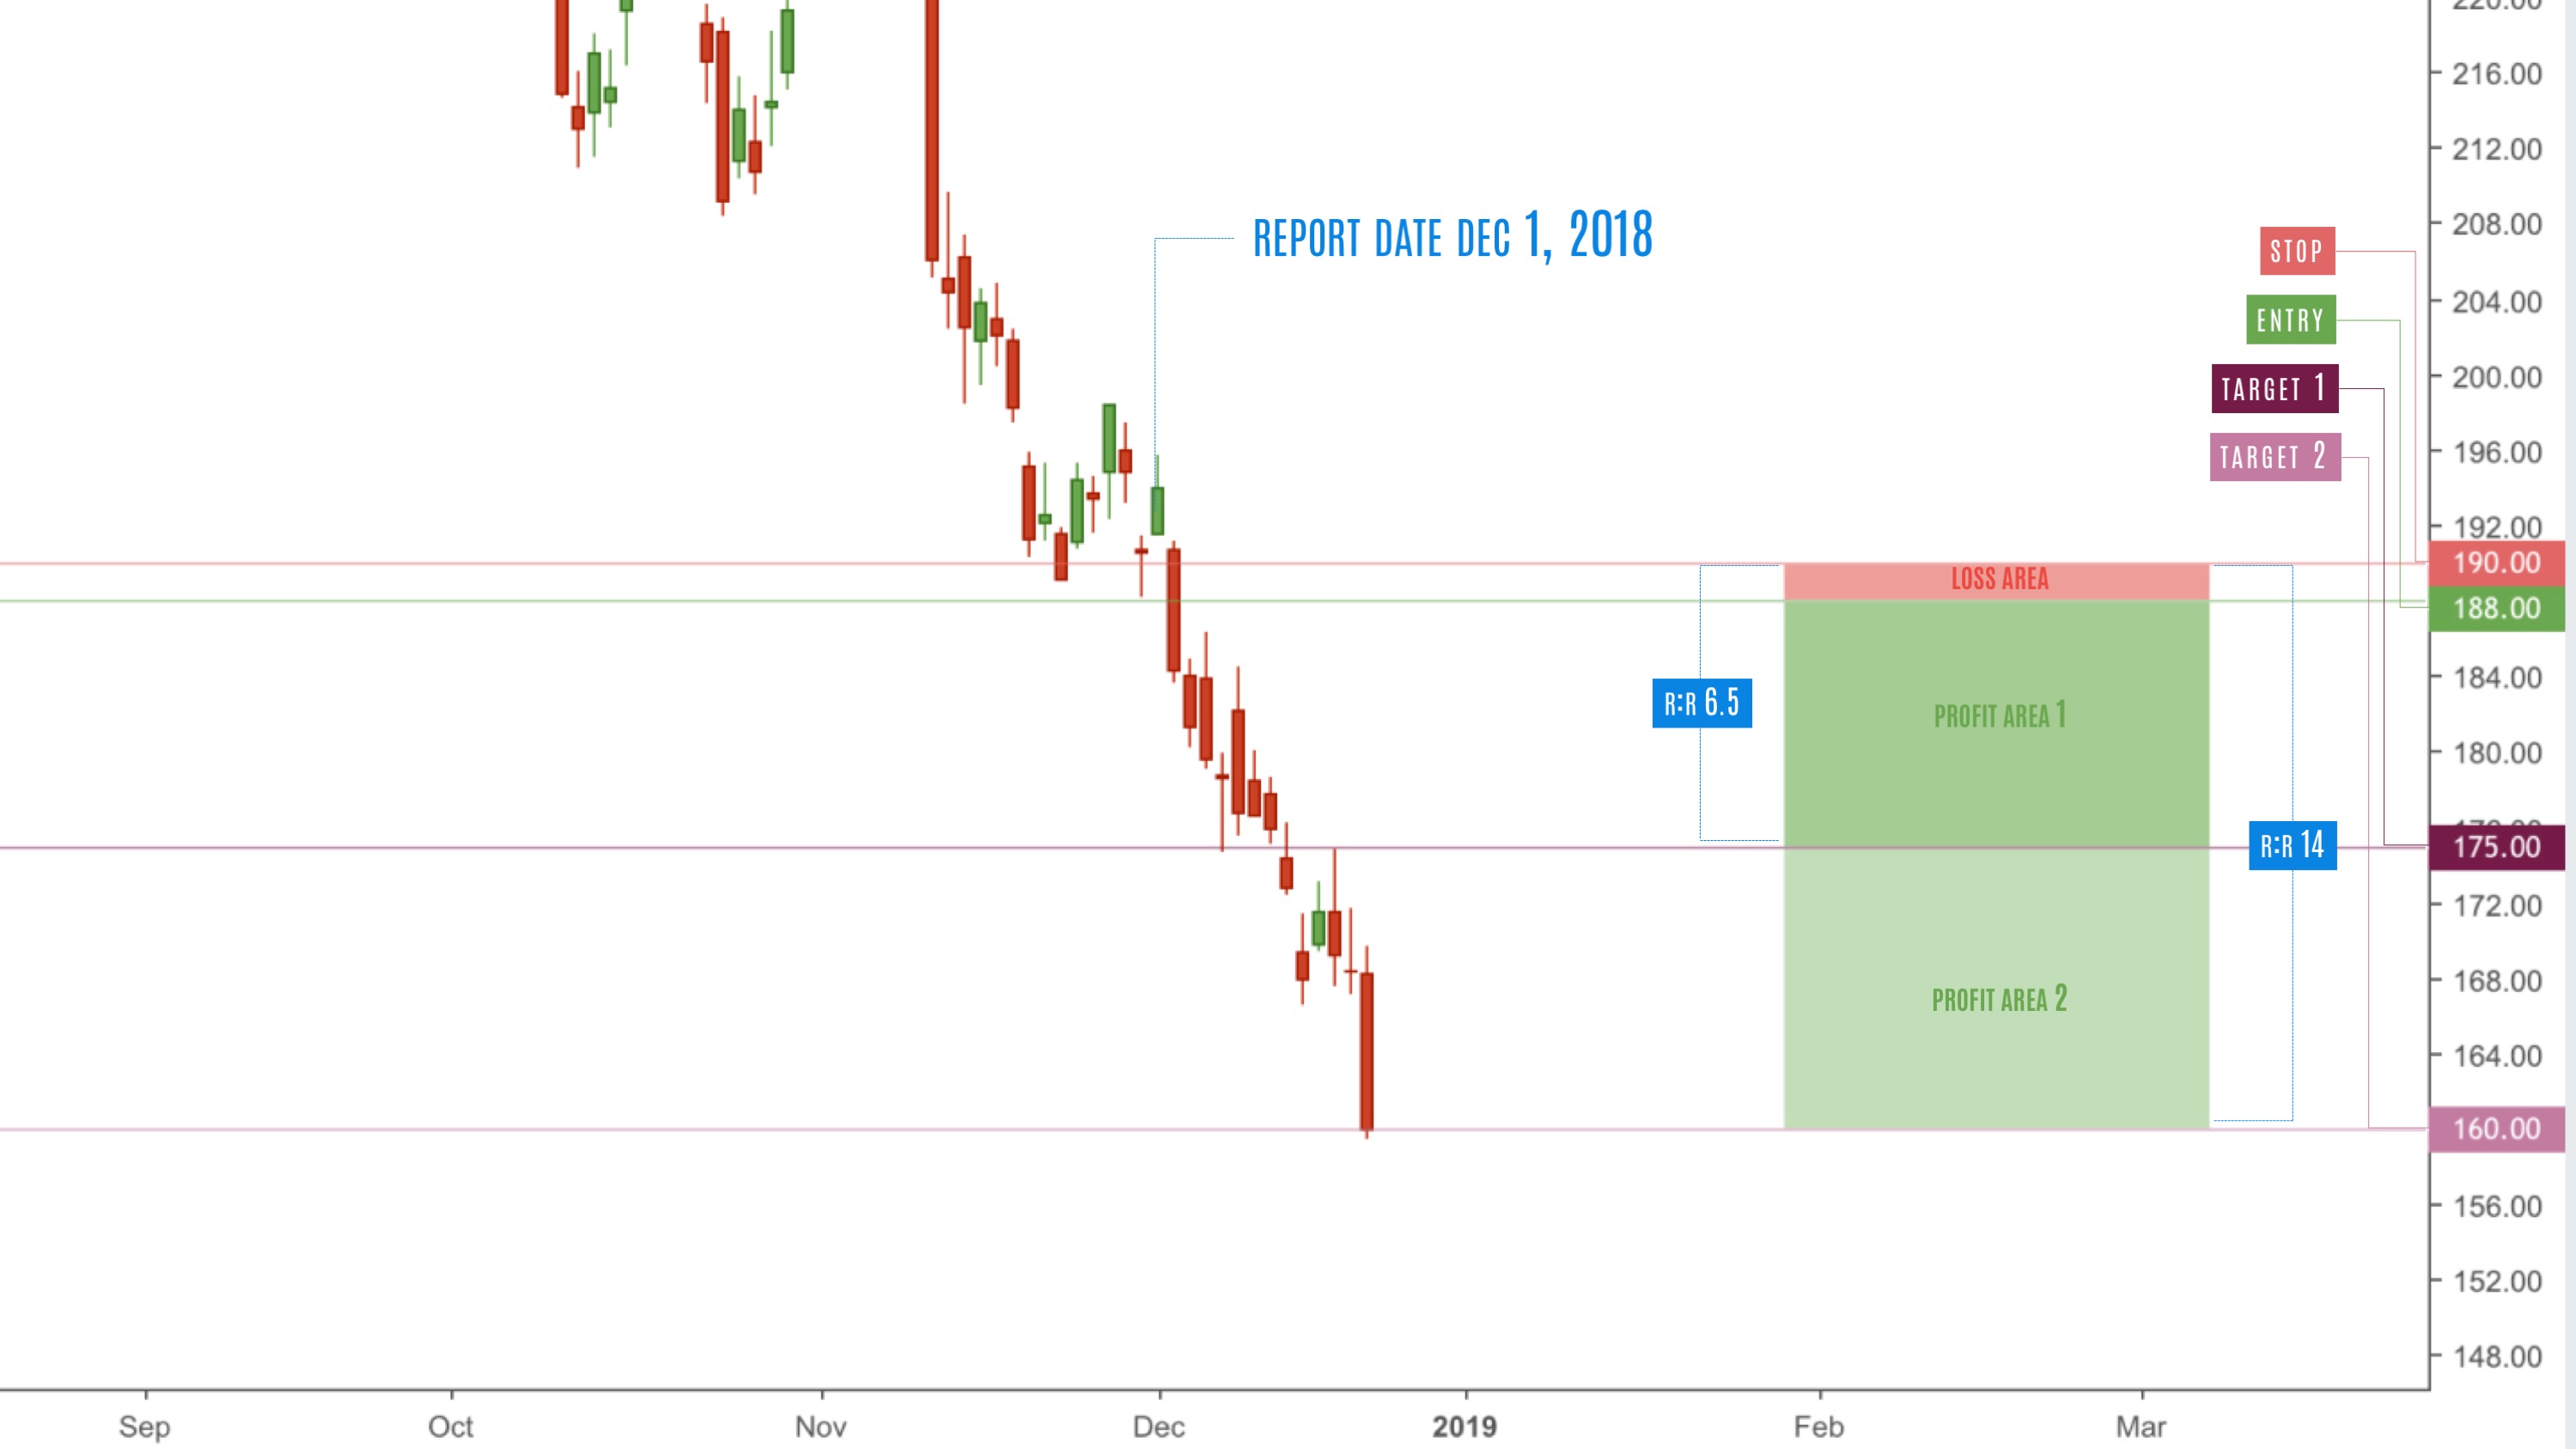
Notice that the R:R worked in our favor even if the trade had a good chance of flopping. Target #2 was hit two weeks after the release of the report. Nicely done.

Getting pragmatic: The Condors case
Our Cash Flow Condors premium system is a powerful and yet simple cash flow system that generates passive income with only one trade per month.
A typical Condor has an inverse R:R, meaning you can lose more than you can potentially make. At first glance, this can sound a little bit scary and make new traders shy away from it.
However, just like their feathered counterparts, they are exotic creatures. In the case of this particular system, although the R:R sounds completely off, 9:1, the POP is extremely high, 82% to 85%. What that means is, despite the fact that the potential loss is nine times the potential gain, you will probably profit on the trade eight times out of ten. That’s the POP bending the R:R perception. Why not? Here’s the case:
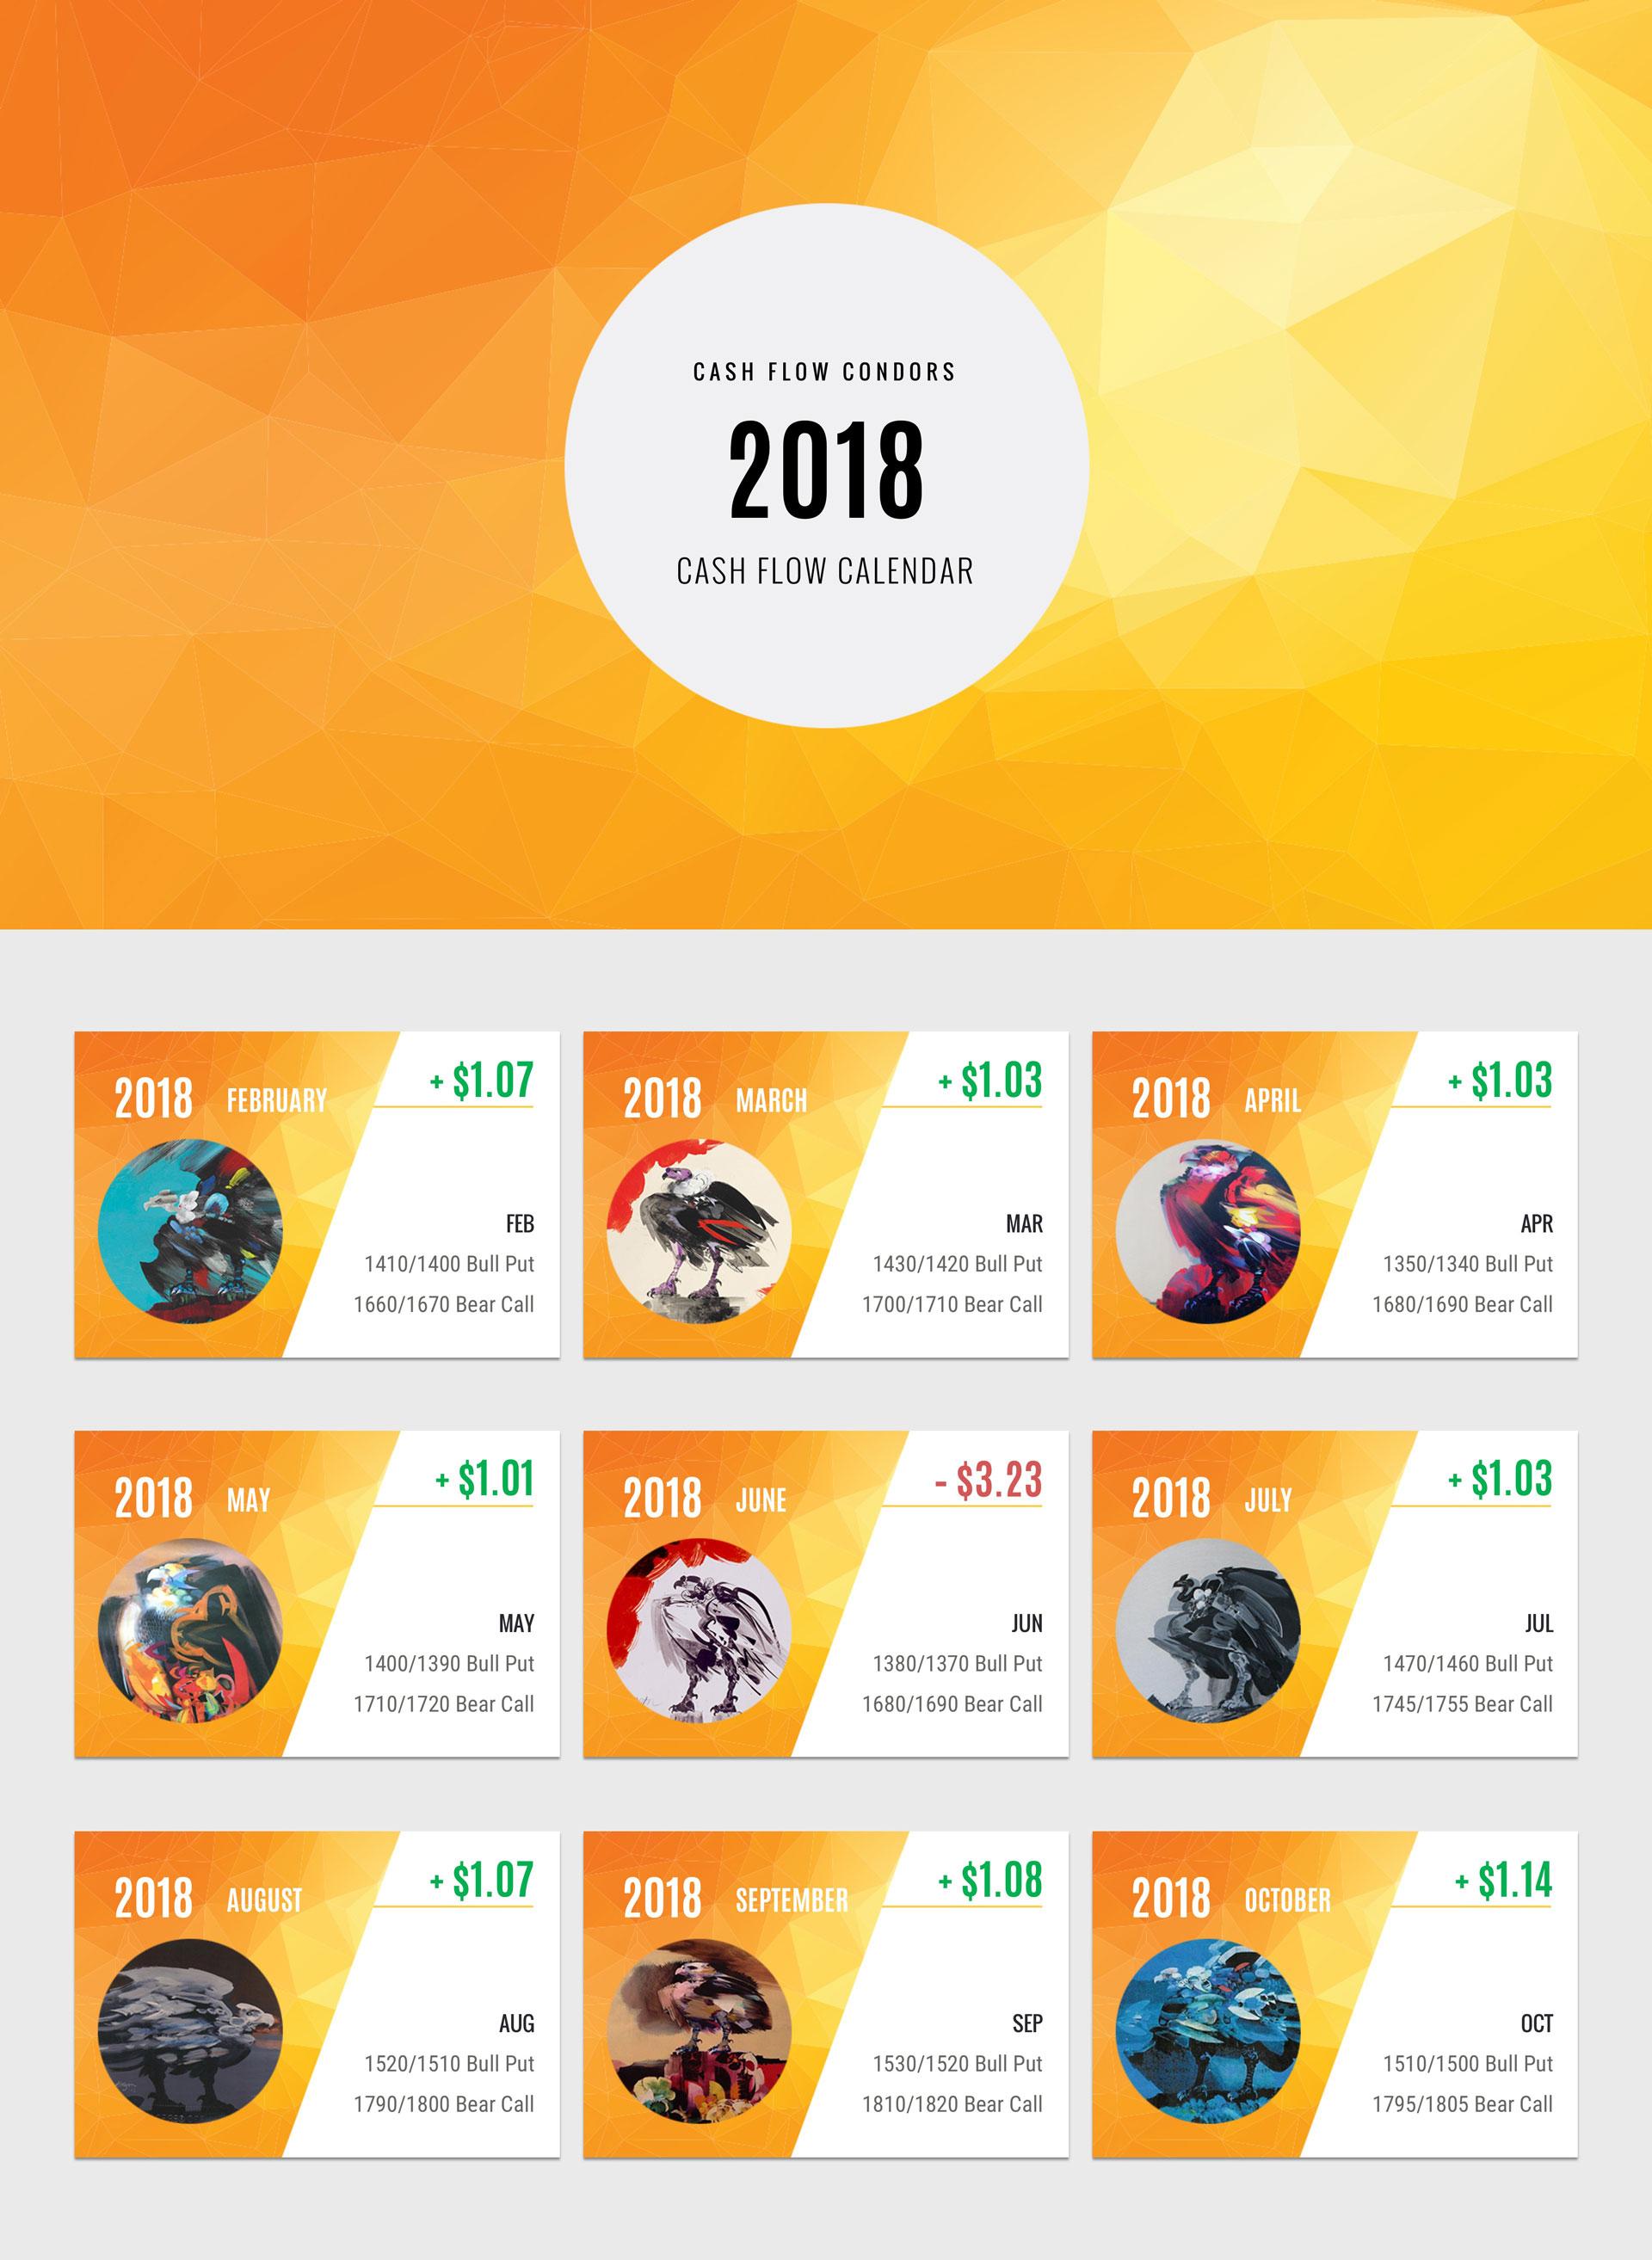
How nice this system looks when presented as a cash flow calendar. That’s what it is, after all: passive income with only one trade per month.
Please, grab a magnifying glass and come along with me. Did you notice that the only loss in nine months was ≈$300? What happened to the initial repulsive 9:1 R:R?
That’s where the Getting pragmatic: Exit before entering approach pays it off. By having clear rules to exit the position for a loss, traders were able to stomach only ⅓ of the initial risk. Original potential R:R = 9:1; actual managed R:R = 3:1. Sweet. Want even a smaller R:R? Set the rules for it and execute them. Free as a bird.
Being a successful trader with an inverse R:R? Check.
Connecting the dots
You can’t connect the dots looking forward; you can only connect them looking backwards. So you have to trust that the dots will somehow connect in your future. You have to trust in something — your gut, destiny, life, karma, whatever. Believing that the dots will connect down the road will give you the confidence to follow your heart even when it leads you off the well-worn path, and that will make all the difference.
From Steve Jobs’ 2005 Stanford Commencement Address
There is only one thing we DON’T WANT you to stay with after the three Holy Trinity editions. It’s the impression that Portfolio Design is one thing, Position Sizing is another, and Risk-Reward Ratio is off the grid. They are all connected. Teaching such dense and complex topics separately hold the same challenges as teaching, for example, cholesterol to students that aspire to become doctors one day. You can’t talk about cholesterol without mentioning the liver, cell membranes, hormones, intestines, enzyme regulation, cholesterol intake and excretion, catabolism, and the role of phospholipids in our body. The same way, Risk and Reward go hand in hand with the probability of profit which bends the perception of the former. The size of the risk in the R:R is the position sizing, which is only –100% of the capital you’ve invested in that particular position, while the reward can be an explosive number which, in turn, will increase your portfolio size leading you to rebalance it while revisiting your goals. Furthermore, you can’t talk about position sizing without meddling with portfolio trilemma and diversification. Additionally, your portfolio should be an extension of yourself, which involves personality traits, goals in life and your perceptions of the market.
Market participants can be divided into two distinct groups: the ones that know nothing and the ones that think they know something. The Holy Trinity of Trading works for the former, not for the latter.
Our statement at the end of the last edition holds true to the entire Holy Trinity series: above all, The Holy Trinity of Trading is an exercise of humility. We don’t move the markets, we follow them. They are indifferent to us and can be very hostile. They are not simple, but utterly complex. Our decision-making process is very much clouded by this complexity. We don’t know the future. Uncertainty lurks. Fat tail events await.
How successful traders and investors are born?
We do hope we’ve helped you find your own answer.

