
Certain aspects of the options market are both a boon and a curse. Take the leverage, for instance. It’s a boon because it allows smart traders to use capital more efficiently and amp up returns during favorable conditions. It’s a curse because naïve traders misuse it and sometimes blow up their accounts.
Here’s another one – the abundance of strategies. The derivatives market offers a veritable smorgasbord of calls, puts, and dozens upon dozens of spreads. To the intelligent investor, this offers precision, specificity, and choice. There’s something for every circumstance under the sun. This is the boon.
But newcomers and even veterans can struggle under the weight of so many options. American psychologist Barry Schwartz wrote a book in 2004 titled The Paradox of Choice. Within, he argued in favor of eliminating consumer choices because it would significantly reduce shoppers’ anxiety. The first time I read this, it rang true. It’s something I suffer every time my wife drags me to The Cheesecake Factory, and I wrestle with their phone-book-of-a-menu.
Hmm, do I want Chinese, Mexican, or American? Or maybe a salad, pizza, and pasta? Steaks, chops, fish, and seafood? So, you’re saying I can order anything and everything? Ok. Give me three hours.
The Paradox of Choice

What initially appears a boon can quickly become a curse. The phrase “analysis paralysis” is often used about the rookie trader battling with the barrage of information attacking him on price charts. (On a side note, he should have read our June newsletter: The Art of Charting). But this sweet-sounding description applies equally well to the budding derivatives trader that stumbled into an options chain and is still trying to determine which strategy is best suited for his stock.
Pro members at Tackle Trading know that our beautifully crafted Playbook includes outlines of 31 different options strategies. To bring order to the chaos, we divide them into three categories: Delta, Theta, and Vega.
Which banner a strategy falls under depends on the primary variable driving its performance. If price direction reigns supreme, then it’s a Delta strategy. If time decay is delivering the profits, then it’s a Theta strategy. Finally, if implied volatility is driving the bus, then it belongs under Vega. (If you need a primer on the greeks, check out July’s newsletter Gods of the Options Realm).
While that basic three-section breakdown provides some order to an otherwise random list of nearly-three dozen strategies, it falls well short of a practical and comprehensive guide for strategy selection.
And that, dear friends, brings us to the crux of the matter – indeed, the purpose of this month’s newsletter. Herein you’ll find a definitive guide to strategy selection. It will lead you to the right strategy to use in each circumstance. Be forewarned, however, that there will be some discretion and personal preference in the process. You are the master of your fate, the captain of your ship. As you’ll soon discover, there are often multiple strategies appropriate for each situation. The ultimate choice, then, lies with you.
Each trader may look at different factors when choosing a strategy, but they typically reside in one of four areas: directional bias, implied volatility, stock price, personal preference. After exploring each one, we’ll conclude the newsletter by combining them to create a strategy matrix.
Directional Bias

The first and arguably most obvious variable to consider is your stock outlook. And this goes well beyond deciding if you’re a bull or bear. Consider the following explanation included in our November 2020 Newsletter titled The Magic of Beta Weighted Delta:
“… It’s oversimplistic to settle on the terms “bull and bear” to express our directional bias. There’s no nuance, no precision. Sure, you can say you’re really bullish or somewhat bullish, but even that’s too fuzzy. What do you mean by “really bullish?”
To provide more specificity for articulating the exact type of bull or bear, we’ve developed a number spectrum.
Bearish is split into three tiers: Aggressively Bearish (-3), Moderately Bearish (-2), Mildly Bearish (-1)
Bullish is also split into three tiers: Aggressively Bullish (+3), Moderately Bullish (+2), Mildly Bullish (+1)
Neutral is representing by a zero (0).
When we put them all together, it looks like this: -3, -2, -1, 0, +1, +2, +3
Equipped with this tool, two traders can now converse more intelligently about their respective outlooks. This is particularly helpful when choosing from the vast array of available options strategies. For example, there are over a dozen bullish strategies. How do you decide which one to use if you think a stock will rise in value? The answer could depend on your degree of bullishness. If you’re only mildly bullish (+1), something like a covered call or naked put might be appropriate. If you’re aggressively bullish (+3), then a long call or bull call spread is the way to go.
The same benefit applies when picking from the handful of bearish strategies available.”
Identifying when a stock is a +1 versus +3 is more of a subjective art than an absolute science. It’s hard enough to get the direction right, let alone guessing the resultant magnitude of the move. And, essentially, that’s what fragmenting bullish into three tiers is doing. Because of the difficulty, don’t spend too much time obsessing over whether a stock is +2 or +3. Or -1 versus -2, for that matter. You’ll probably be wrong just as often as you’re right. Besides, if you enter a +2 strategy, you’ll still capture a profit if the market ends up being +3.
We say again, getting direction right is the ultimate goal. If you nail magnitude as well, consider it a bonus. That said, if you’d like a tip or two on what we look for when upgrading our outlook to more bullish or downgrading it to more bearish, then go back and re-read November’s newsletter.
Now, a question to ponder. If a bull is the opposite of a bear, what is the opposite of neutral?
The answer is bi-directional. Think about neutral from a volatility perspective. Trades that profit from a sideways environment also benefit from low volatility—little movement, in other words. Significant activity or high volatility, then, is the opposite. The term bi-directional refers to a strategy that thrives when markets move aggressively higher or lower.
In sum, you have one of four categories to choose from when it comes to your directional bias. These will comprise the rows of our soon to be revealed strategy matrix.
Implied Volatility Bias

Like any freely traded good, the price of an options contract waxes and wanes depending on investor appetite. When demand exceeds supply, prices rise, and vice versa. The cost or premium of an option provides a second variable we can use when facing the tricky question of strategy selection.
This one is intuitive.
When options are expensive, we prefer to sell them. When they are cheap, we like to buy them. It turns out about half of the options strategies you’ll learn involve purchasing premium. It’s more commonly referred to as going long an option or spread. The other half consists of selling premium or going short an option or spread.
If you’re a Greek geek, then you can view this from the perspective of Vega. When options are cheap, we want to enter positive vega strategies. When they are expensive, we favor negative vega strategies. Here’s a brief breakdown of some of the more common trades to make sure you’re following along.
Positive Vega: long call, long put, long straddle, long strangle, bull call vertical, bear put vertical, bull call diagonal (aka poor boy’s covered call), calendar spreads, inverted fly, debit condor
Negative Vega: short call, short put, short strangle, covered call, bull put vertical, bear call vertical, iron condor
Implied volatility is the indicator that professional traders use to determine if contracts are cheap or rich. There are multiple ways to slice and dice the data, but an excellent place to start (and potentially end) is implied volatility rank, or IVR for short.
You can add it to the bottom panel of your chart, and it’s plotted as a line that oscillates between 100 and 0. It tells you where implied volatility sits relative to its one-year range. A reading of zero means implied vol is at its lowest point of the past 52-weeks. A 100 reading would signal it’s perched at the highest level of the year.
The 50 zone marks the midpoint of the range. You might think that anything above 50 is high and anything below 50 is low, but it’s more nuanced than that. As it turns out, implied volatility spends the lion’s share of its time below 50. As such, we must be more discriminating in determining what is low. Generally, we say a reading below 25 is low. It means implied vol is trading in the lower quartile of its one-year range.

To help you identify when volatility is low, medium, or high, the IVR is color-coded. It appears red below 25, yellow between 25 and 50, and green above 50. Just so nothing got lost in the shuffle, green suggests options are rich and thus more attractive to sell. Red signals they’re cheap and therefore more attractive to buy (or, at least, less tempting to sell). Yellow essentially means you can take your pick. In those instances, I usually rely on one of the other variables (such as directional bias or personal preference) to sway me in my strategy selection.
In the graphic above, the IV Rank is 28.58%. Note how the boxes in the top left of the panel are colored yellow. In this example, options are neither extremely rich nor especially cheap. As such, I would let my directional bias point the way.
Implied volatility will make up the columns of our strategy matrix.
Stock Price Bias
A third factor entering our decision-making is the stock price. It’s undoubtedly the most straightforward of the quartet. With cheaper securities, such as those below $50 or $60, naked options are easier to deploy because of the low-cost. This includes both buying and selling them. Say you want to deploy an aggressively bullish (+3) strategy on a $25 stock. Do you think you need to fiddle with an elaborate spread trade? No. Just buy a call option.
If I were instead aggressively bearish (-3) on the same stock, I probably wouldn’t mess with a put spread. I’d purchase a straight put option.
Alternatively, if we were considering directional plays on a richly priced stock such as Amazon ($3,000+) or Alphabet ($1,700+), it’s challenging to use long calls and puts. They cost thousands and carry huge amounts of risk, even with a tight stop loss. Spreads, then, are favorable over long calls and puts for higher-priced equities.
The same principle applies to cash flow strategies like naked puts and naked calls. They’re easy to enter on the cheap stocks of the world because the margin required is minimal. Try the same strategy on the Amazons of the world, however, and your broker will charge a mint.
This is why veteran traders usually pivot to bull puts instead of naked puts and bear calls instead of naked calls when selling premium on expensive equities. It’s a more efficient use of capital and generates a superior return on investment.
It’s up to each trader to decide where the line stands between a low price and a high price. Those with larger account balances can afford a higher price threshold for selling naked options than those wielding less capital.
Before investigating the final factor, let’s unveil the strategy matrix.
Behold, the Strategy Matrix
With these decision-making principles now under our belt, we’re prepared to discuss the strategy matrix. We’ve prepopulated the most common strategies in their respective sections to illustrate how the tool works.
The two columns separate which strategies are ideal when implied volatility is low versus high. And the four rows outline the directional biases we mentioned above. Take a moment to study the following graphic.
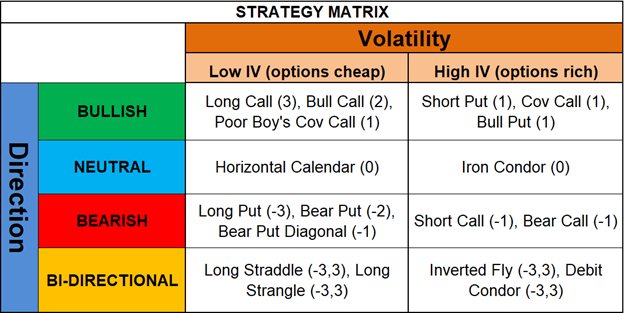
To better understand how to use the matrix, we’ll provide a few case studies at the end of the newsletter. But first, let’s tackle one more essential factor in the strategy selection equation.
Personal Preference
The final item to consider when selecting options strategies is your personal preference. This, above all else, is driven by experience. Over time, you’ll discover you do better with specific tools versus others. For instance, if you’re a superb chart reader and have a high win rate when forecasting price direction, then you’ll probably favor more directional strategies because they deliver a bigger payday. Alternatively, if you struggle with market timing and have a less desirable win rate, you will likely favor cash flow strategies.
A second consideration is which strategies you’re better equipped to manage. Perhaps you like bull put spreads because you have more adjustment techniques for them versus other bullish strategies. And, over time, you discover you generate superior results with these cash flow plays.
Ultimately, you will lean into the strategies you’re the most comfortable managing and those you’ve had the most success with.
With the personal preference piece in place, you can now customize the strategy matrix to focus on your playbook. For instance, suppose you don’t like bi-directional strategies and haven’t seen much success with buying calls and puts. Furthermore, you discover horizontal calendar spreads are too hit and miss. Finally, your portfolio is smaller, making long stock trades too expensive (and thus Covered Calls untenable). Based on these adjustments, your matrix might look more like this:
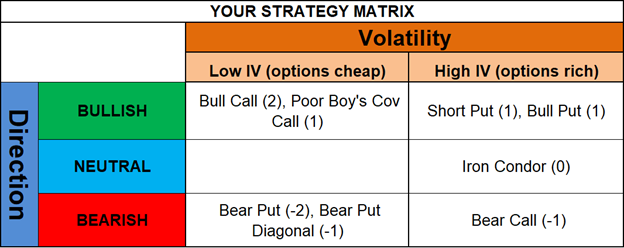
It’s impossible to master the art of strategy selection in a single sitting. But we trust that this month’s newsletter allowed you to make significant strides in your understanding. Return to it as much as needed until you’ve internalized the principles. With time and experience, you will reach a point where the appropriate strategy springs to mind after merely glancing at a chart.
With that, let’s end with a few case studies. I’ll be using the fuller version of the matrix above.
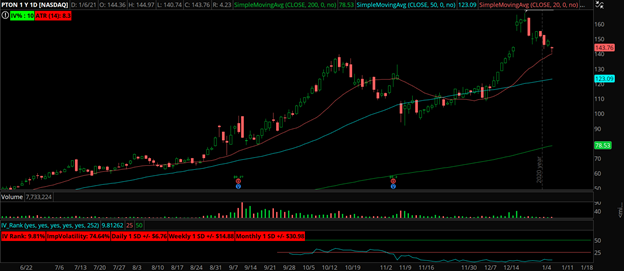
Peloton (PTON): $143.76
Peloton has a bull retracement pattern. Based on the trajectory of its trend and the last upswing’s strength, I’m pegging our bias at moderately bullish (+2). The Implied volatility rank is in the lower quartile of the range at the 10th percentile (9.81% to be exact). That narrows our choice down to a long call or a bull call. Though I labeled the long call a +3 and the bull call +2, the reality is they’re somewhat interchangeable. Given the slightly higher stock price and my preference toward spreads, I’m opting for a bull call spread strategy such as the March $150/$160.
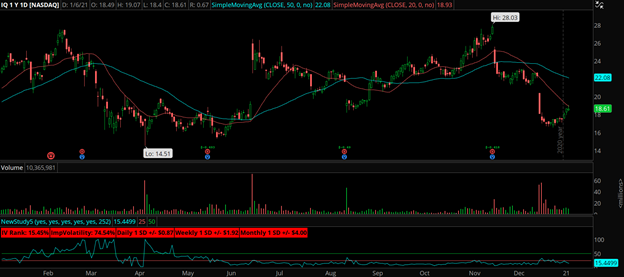
Iqiyi (IQ): $18.61
Iqiyi has a bear retracement pattern. Its price got torched on the last two drops leading me to a -3 directional bias. The Implied volatility rank is in the lower quartile of the range at the 15th percentile, suggesting premiums are cheap and long options is the way to go. That winnows our choice down to either a bear put or long put. Like the PTON example, I view a bear put and long put virtually interchangeable from a directional bias perspective. Because of the cheap price tag of IQ and my willingness to go aggressively bearish, I’m playing a long put option such as buying the March $20 put.
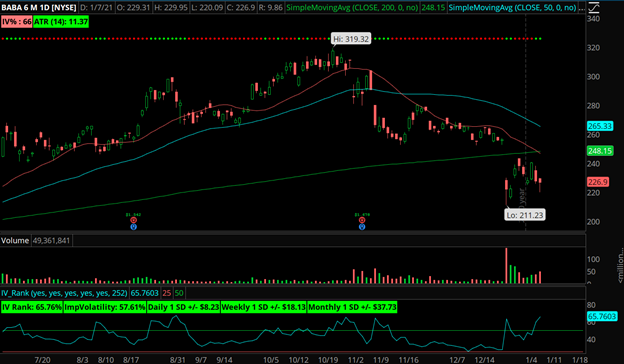
Alibaba (BABA): $226.90
Alibaba finds itself in a downtrend below all major moving averages. That, coupled with the last two weeks of choppy price action, lead me to a bias of -1 or -2. On the implied volatility front, demand for options is high, creating an IV rank of 66%. The conclusion is that premiums are expensive. A bear call spread might be appropriate in this situation, such as selling the Feb $270/$280.
Legal Disclaimer
Trading Justice LLC (“Trading Justice”) is providing this website and any related materials, including newsletters, blog posts, videos, social media postings and any other communications (collectively, the “Materials”) on an “as-is” basis. This means that although Trading Justice strives to make the information accurate, thorough and current, neither Trading Justice nor the author(s) of the Materials or the moderators guarantee or warrant the Materials or accept liability for any damage, loss or expense arising from the use of the Materials, whether based in tort, contract, or otherwise. Tackle Trading is providing the Materials for educational purposes only. We are not providing legal, accounting, or financial advisory services, and this is not a solicitation or recommendation to buy or sell any stocks, options, or other financial instruments or investments. Examples that address specific assets, stocks, options or other financial instrument transactions are for illustrative purposes only and are not intended to represent specific trades or transactions that we have conducted. In fact, for the purpose of illustration, we may use examples that are different from or contrary to transactions we have conducted or positions we hold. Furthermore, this website and any information or training herein are not intended as a solicitation for any future relationship, business or otherwise, between the users and the moderators. No express or implied warranties are being made with respect to these services and products. By using the Materials, each user agrees to indemnify and hold Trading Justice harmless from all losses, expenses, and costs, including reasonable attorneys’ fees, arising out of or resulting from user’s use of the Materials. In no event shall Tackle Trading or the author(s) or moderators be liable for any direct, special, consequential or incidental damages arising out of or related to the Materials. If this limitation on damages is not enforceable in some states, the total amount of Trading Justice’s liability to the user or others shall not exceed the amount paid by the user for such Materials.
All investing and trading in the securities market involve a high degree of risk. Any decisions to place trades in the financial markets, including trading in stocks, options or other financial instruments, is a personal decision that should only be made after conducting thorough independent research, including a personal risk and financial assessment, and prior consultation with the user’s investment, legal, tax, and accounting advisers, to determine whether such trading or investment is appropriate for that user.
