The Art of the Reversal
Technical analysis is not a complicated study. It takes time and discipline but it is not difficult. It is the study of patterns of which we have  been studying our entire lives. Patterns have a tendency to repeat themselves over and over and over until they stop. When they stop, this is the reversal. With the market at the top end of the macro financial cycle, I felt it best to write about the art of the reversal. There are a few different reversal patterns such as the head and shoulders or murder formation at the top of a bullish market or the inverted head and shoulders or winner formation at the bottom of the bear market. Despite different types of patterns, there are common elements if the reversal. Basically, the market is like climbing a mountain. Tough to go up, very easy to go down, especially once you fall of the cliff.
Step 1: Slowing Momentum: The vertical distance in price between resistance pivots is the best measure of momentum. Expanded resistance is a strong indication of a strengthening trend. In the example below you see two different examples of momentum. The example on the left shows a trend with increasing momentum. The range on the upward price swings is increasing. This is what you want in a trend. If it is consistent then you can go ahead and trade bullish retracements as well. In the example on the right you see a trend with slowing momentum. When momentum is slowing demand is slowing. Buyers are becoming less willing to push price to new highs. This is an expression that supply is slowly overcoming demand and the trend may soon reverse. Technical analysis is the historical record of price over time. The subtleties like momentum and pattern are conditions that a technician looks for to better understand supply and demand. When we see characteristics that make us believe the trend is slowing – like momentum, reversal candles and certain volume patterns – then we avoid those situations for certain types of entry points.
Slowing momentum is also the first sign that the trend is starting to falter. Think about climbing a mountain. When you first start climbing the mountain you are fresh, the terrain in not too bad, the air is easier to breath and the vertical distance is not that difficult. However, as you get higher and higher it become much more difficult. You get tired, the air is harder to breath, the terrain is more difficult and the vertical distance is higher. The reality is that you simply slow down. Then you get to the top of the mountain and there is nowhere to go but back down but before you do, you are going to enjoy some rest, take in the sights and get ready to go back down the mountain. You start to go back down the mountain and it is much easier to go down than it is up so your speed increases, you get faster and then you fall off a cliff and you get vertical very fast. This is the bearish reversal patterns. It takes time but once it starts going down, it goes down fast. Take for example the 2007 reversal in the S&P 500 (SPY).
In September of 2005 the market was clearly in a bullish up trend and in the middle of the market cycle. A bullish uptrend is established by a series of higher levels of resistance and higher levels of support. In 2005 that Resistance level was establish at 125 on the SPY. Over the next few months (May 2006) the market set another resistance level at 132.50 which is an increase of 7.5 or 6%.
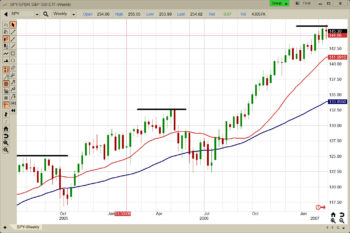
By February of 2006 the market extended the higher high of resistance to 146 which is an increase of 13.5 or 10%. This is considered increasing momentum and the trend is likely to continue. However, in July the Market had establish resistance again at 155 which is still an increase in resistance but a decrease from the last expansion. This is slowing momentum. It does not mean the market is going to go down. It simply means the market is slowing down and we might want to hold back a little on the bullish assessment.
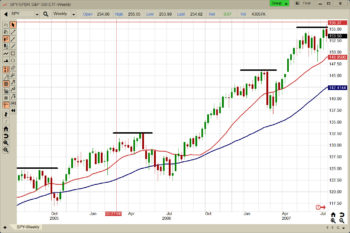
Step 2: Double Top: One of the two defining patterns that must repeat for a bullish up trend to continue is for resistance to constantly increase. When resistance holds, that is the end of the trend. That does not mean the market is ready to sell and does not mean the market is bearish. It simply means the market is now slightly bullish and the trader may want to adjust their bullish delta to more of a slightly bullish delta. One common error is to assume the reversal is now coming. It may and it may not. There are reversal pattern and continuation patterns. We simply do not know yet. In 2007 the double top occurred in October.
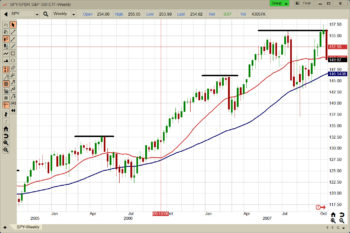
Step 3: Double Bottom: The second pattern that must repeat for the bullish uptrend to continue is support increasing. This is what creates the motive wave / corrective wave pattern or otherwise known as the Higher High / Higher Low. When support holds, the trend is no longer slightly bullish as it takes out the continuation patterns such as the cup and handle, ascending triangle and even the symmetrical triangle. It is now neutral and the trader wants to maintain a neutral delta
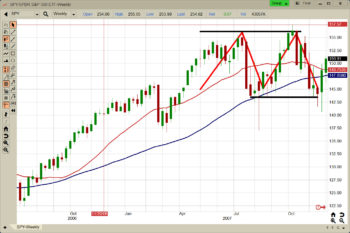
Step 4: Support Breaks: The breaking of support starts the bearish downtrend. This is where the trader will shift from Neutral to Slightly Bearish. We never take radical steps, we take logical and calculated steps. The trader will look to increase bearish trades and potentially add insurance (put options) to the retirement accounts. Typically the candle on the break down will be and expanded candle (wide body) with increased volume as hedge funds, HFTs, and institutions all start to sell.
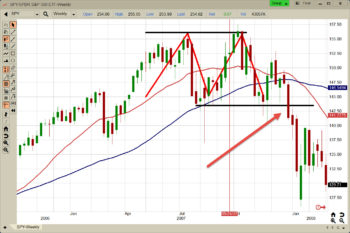
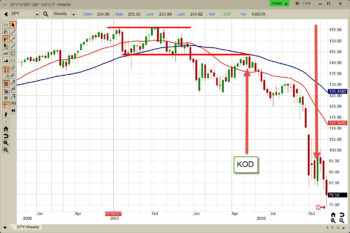
Step 5: Kiss of Death (KOD): The KOD is the one of the most powerful bearish pattern the market offers. It is considered the first retracement after the market establishes a firm downtrend by setting the first lower low. There will be two things that happen once support is established. First, the traders will start locking in profit on their short trades but buying to close driving the market up. Second, there will be a buy the dip mentality from some in the market thus driving the market back into resistance.
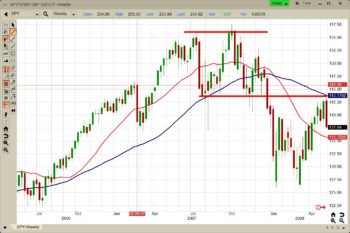
This is not a bottom, it is a fake bottom. It is temporary as the market drives back into the old support level it just broke. At this point is like the market literally falling of a cliff as everyone rushes to sell their shares and the traders start taking more short positions.
