


In this month’s newsletter, we’re unpacking one of the finest strategies on the Street. Its strengths are many, its weaknesses few. And its proper deployment will bring good fortune to you.
Now that we’ve sated our inner poet let’s get down to business.
Today’s strategy is a man of many names. Some call him the naked put, and while it’s a moniker that hints at the naughty, we can assure you he’s as nice as they come. Others prefer the title of short put which touches on the mechanics of the trade. For all its sizzle, this strategy is no more complicated than selling a put option. A third nickname is that of the synthetic covered call. It’s a mouthful, yes, but reveals that selling puts provide a short-cut to capturing all the gains offered by the mighty covered call strategy.
In the carefully crafted content below, we will explain the strategy from every angle. By the end you will be one giant step closer to using short puts in your trading account.
Get Paid for a Promise
The options market is a place where you can go to get paid for making promises. It’s a wonderful premise. And, in many cases, you don’t even have to make good on said promises. Chew on that for a moment. As an options trader, you will have the ability to get paid for promises you rarely have to fulfill.
And this is not a novel concept. In fact, it’s already used by many industries to print billions of dollars in profits. Let’s start with the gaming industry. Think about Las Vegas. It has bright lights, booze, and entertainment aplenty. But its golden goose is a mathematically driven game boasting promises of riches that rarely, if ever, get fulfilled. Yes, we’re talking about gambling in all its variety. Slot machines, craps, roulette, and the like – all designed to extract profits from the players to the house systematically.
The casino offers promises of riches and lemmings line up from sunrise to sunset to have their Benjamins taken without prejudice. In the options market you, dear reader, can be like the casino.
Yet another, perhaps more telling, analogy is that of the insurance company. Think of the bounty of promises that get paid for in this industry. The automobile insurer makes a promise to buy you a new car in the event of an accident. The health insurance company promises to pay your medical bills if you get put in the hospital. The life insurance company promises to cut your beneficiaries a check if you slip on a banana peel at the Grand Canyon. Etcetera, Etcetera, Etcetera.
The Geicos, Farmers and All States of the world get paid every single month in exchange for making promises they very rarely have to make good on.
This month’s strategy offers just such an opportunity.
Contract Specs
To set the foundation for your venture, a brief review of options basics is in order. We’ll leave call options for another day and focus instead on the put. Here is the definition:
A put option is a contract that gives the buyer the right, but not the obligation, to sell a stock at a specific price on or before a specific date.
Traders that buy puts, then, acquire the right to sell a stock. Which, I suppose, begs the question – who are they selling the stock to? The answer is simple. It’s the party that sold the put. Remember, options can be both bought and sold. There is always two parties to every transaction. Buying an option brings rights, but selling brings obligations. And do you know what another word for obligation is? A promise.
Put buyers (i.e., long puts) have the right to sell stock.
Put sellers (i.e., short puts) have an obligation to buy stock. Let’s look at an example to help solidify your understanding.
Twitter (TWTR) is trading for $33.50, and the one-month $31-strike put is trading for 50 cents. If you wanted to acquire the right to sell the stock at $31, you would buy the $31-strike put by shelling out $50 (50 cents x 100). By the way, the reasons someone might purchase the put are myriad. Maybe they own Twitter stock and want to protect it. Locking in the right to sell TWTR at $31 limits the downside if the stock crashes. Perhaps they don’t own the stock and simply want to place a bearish bet (remember, puts rise in value if the stock falls). Or maybe the trader has some bullish options position in Twitter and wants merely to hedge the trade. Ultimately, the reason doesn’t matter.
Now, the option seller. If we sold the $31-strike put we would be promising to buy the stock at $31. With Twitter shares currently trading for $33.50 in the marketplace, we’re effectively obligating ourselves to purchase it at a 7.5% discount. To make the numbers even more complete, let’s take this one step further. When you sold the put, you received $50. Consider that the compensation for your troubles. We’re not just making promises. We’re getting paid to make promises. So, if you end up having to buy the stock at $31, your true cost basis falls to $30.50 because of the premium you garnered up front. Technically you’re obligating yourself to buy TWTR at a 9% discount.
The next question to tackle is why someone would want to sell a put. Let’s look at two possible motivations.
The Casino
You want to be a casino by making promises you rarely have to make good on. If Twitter stock never falls below $31, then the put will expire worthless, and you get to keep the $50 credit you received at trade inception. This is perhaps the simplest way to think about put options. The person who buys the $31-strike put is betting the stock will fall below $31 by expiration. The person who sells the $31-strike put is betting the stock will stay above $31.
Selling puts, then, offers a way to wager on where a stock price won’t go. If it’s a $75 stock that you don’t think will fall below $70, then sell the $70-strike put. If it’s a $27 stock that you don’t think will drop below $25, then sell the $25-strike put.
This approach uses the naked put as a cash flow strategy. Like a casino, the majority of the outcomes involve simply collecting cash and dodging the fulfillment of any promises made.
The Promise Keeper
The other reason for selling puts is doing so with the intent of buying the stock at the strike price if it ends up falling there. Traders may follow this route if it’s a company that they’d love to buy shares of, if only at a discount. For example, maybe you’ve been eyeing Twitter and are interested in accumulating shares. Rather than buying them at the current price of $33.50, why not get paid to grab them on sale?
Think of it. The short put strategy allows you to get paid to buy something you already wanted to buy, but for a discount. In the case of Twitter, you either buy the 100 shares now at $33.50, or you get paid $50 for your willingness to buy it at $31. If the stock remains above $31, your profit is limited to the initial $50 received. If the stock falls below $31 then you will be obligated to purchase 100 shares at $31 minus the initial 50 cents premium – or, $30.50.
Does this not seem like a win-win?
Let’s recap to make sure nothing fell through the cracks. You like Twitter and are a willing buyer at a discount, so you sell the one-month $31-strike put for $50. If the bluebird continues to soar, then the put expires worthless, and you capture a $50 profit. But, if the stock dives below $31 you have to buy it at an effective purchase price of $30.50 which is a 9% discount to the price you would of paid for the stock at the beginning of the trade. Here’s how you might think of the two outcomes:
Outcome One: Capture $50 profit.
Outcome Two: Buy Twitter at a 9% discount to its current price.
Like we said, WIN-WIN. Furthermore, some sell puts with the intention of being assigned so that they can then sell covered calls on the stock. This is why you sometimes hear of naked puts as the front end of a covered call strategy.
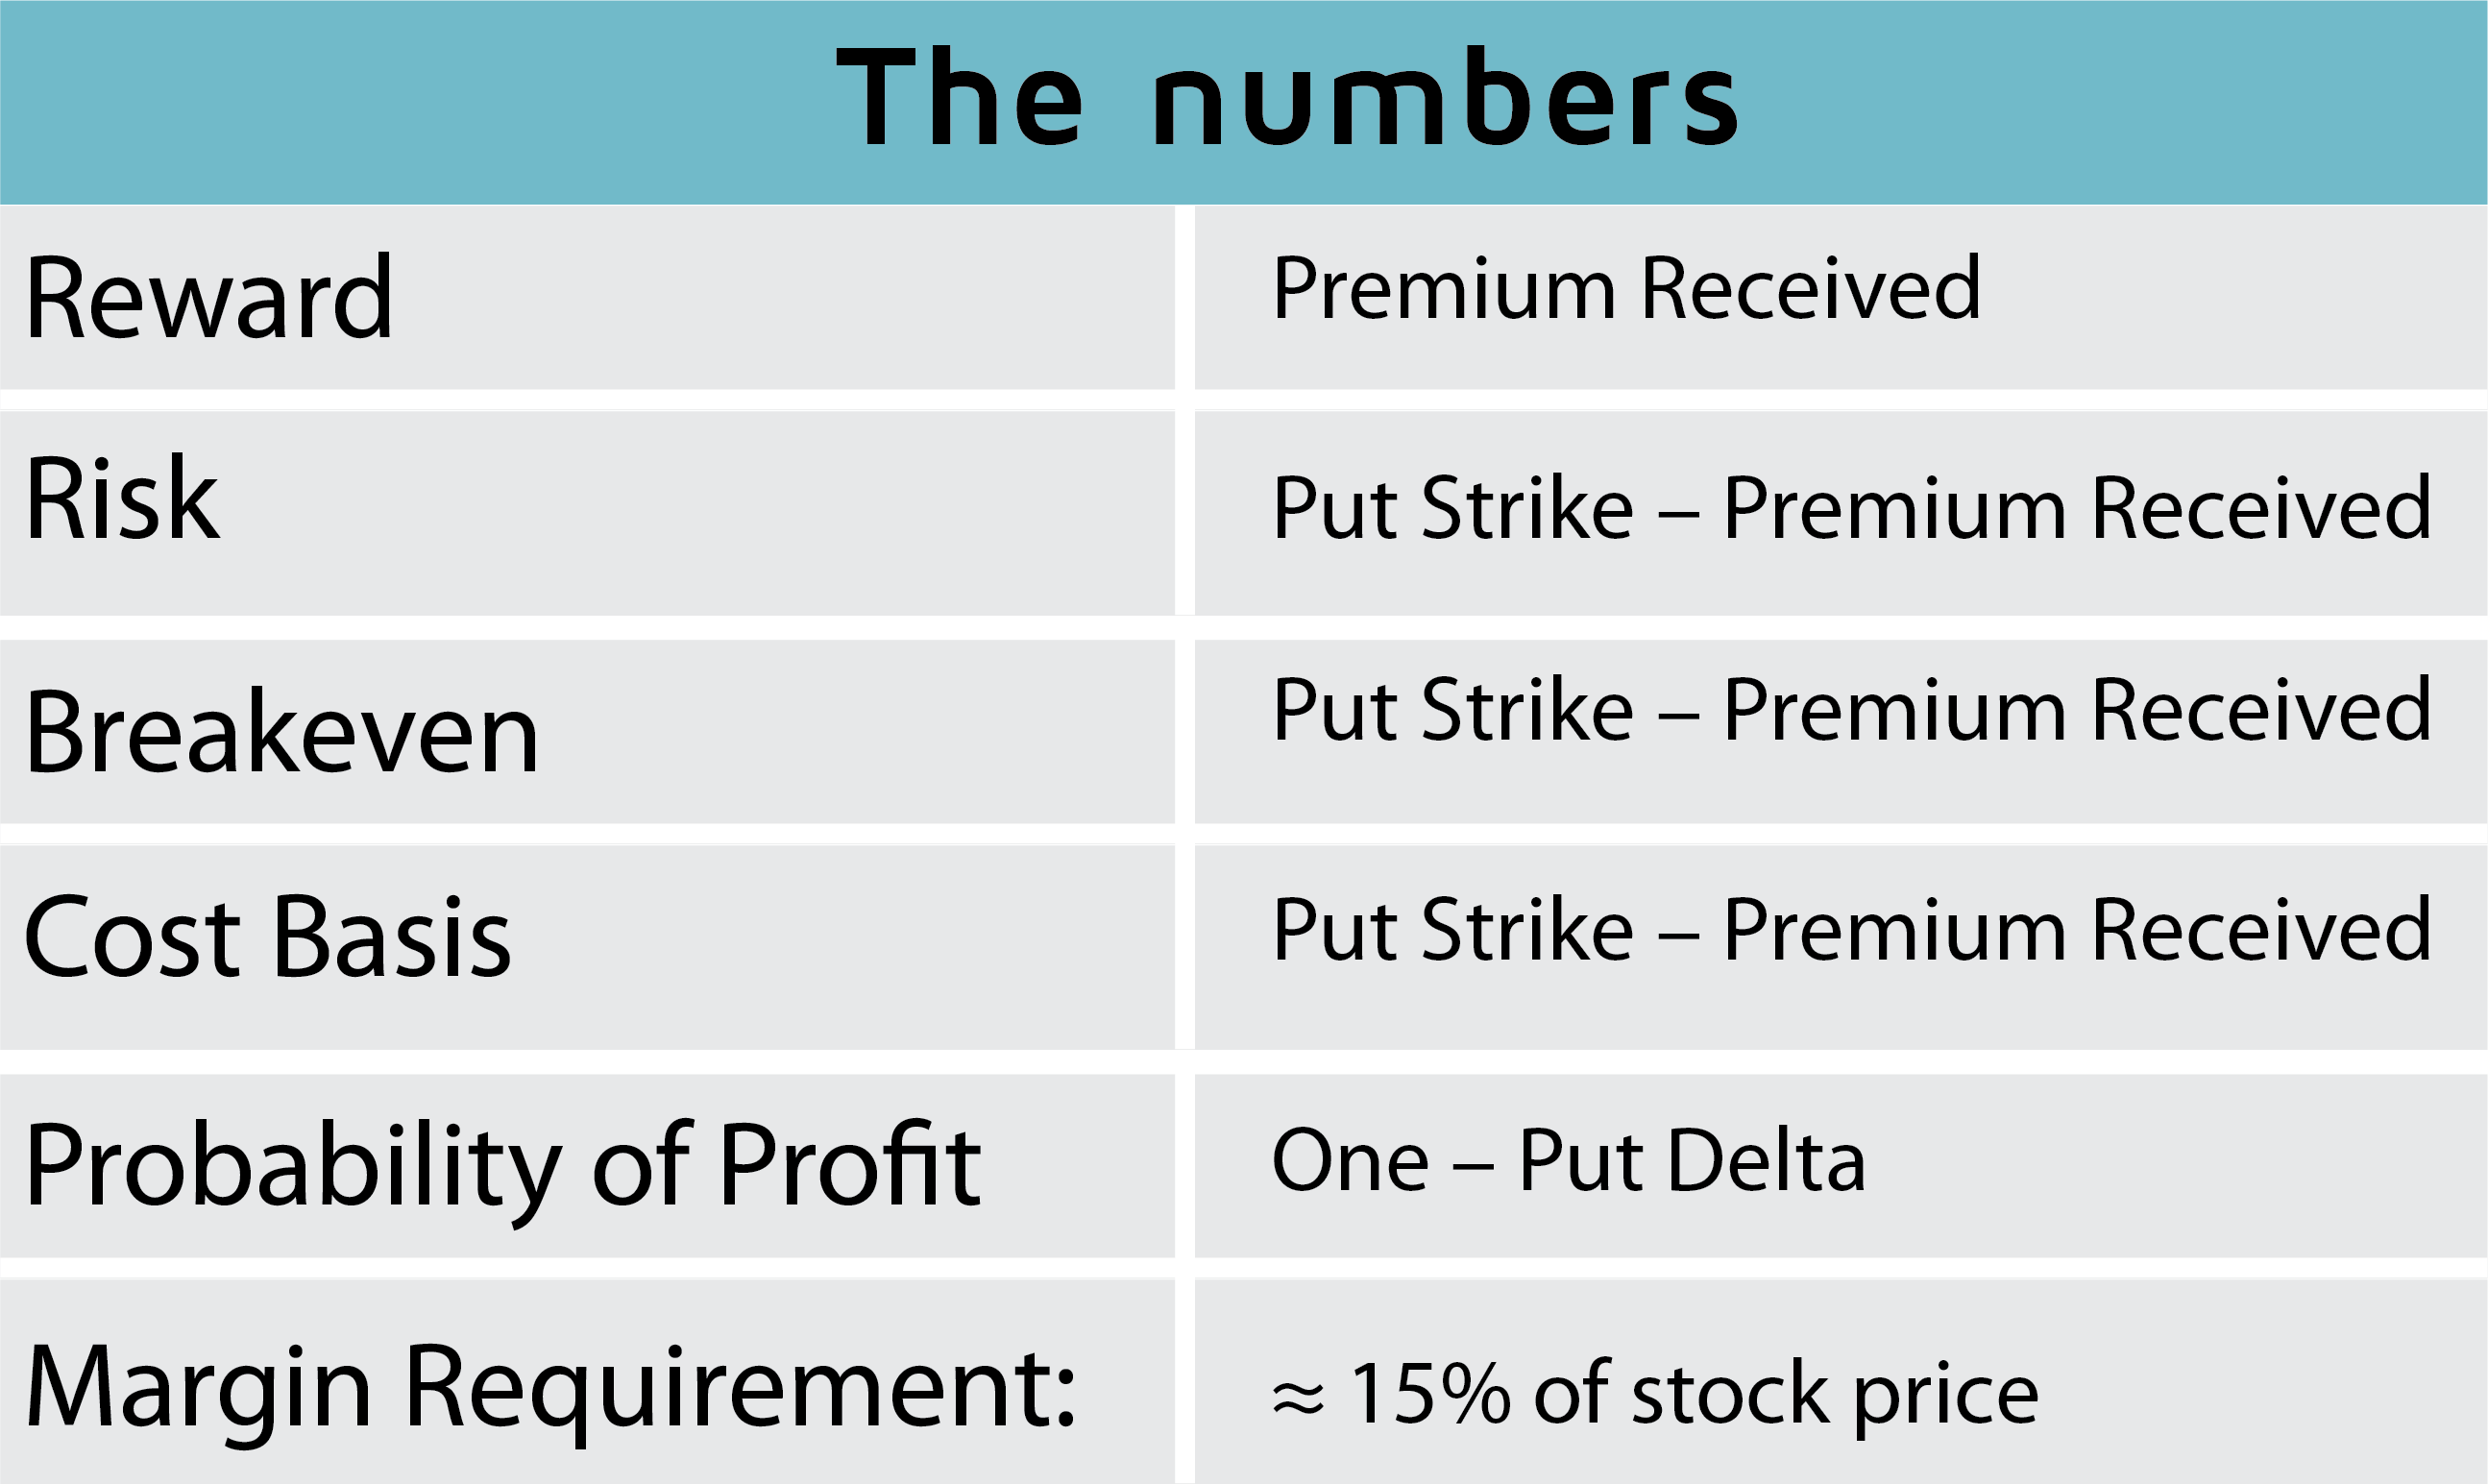
As with any strategy, understanding the relevant numbers is crucial. Without having the formulas down cold, you won’t know how much profit or loss could be waiting in the wings. Here are the relevant metrics for the naked put:
Let’s make sure we understand how these formulas would work out for the Twitter example. Remember, the current stock price is $33.50, and we’re selling a one-month $31-strike put for 50 cents. Furthermore, suppose the put delta is 0.10.
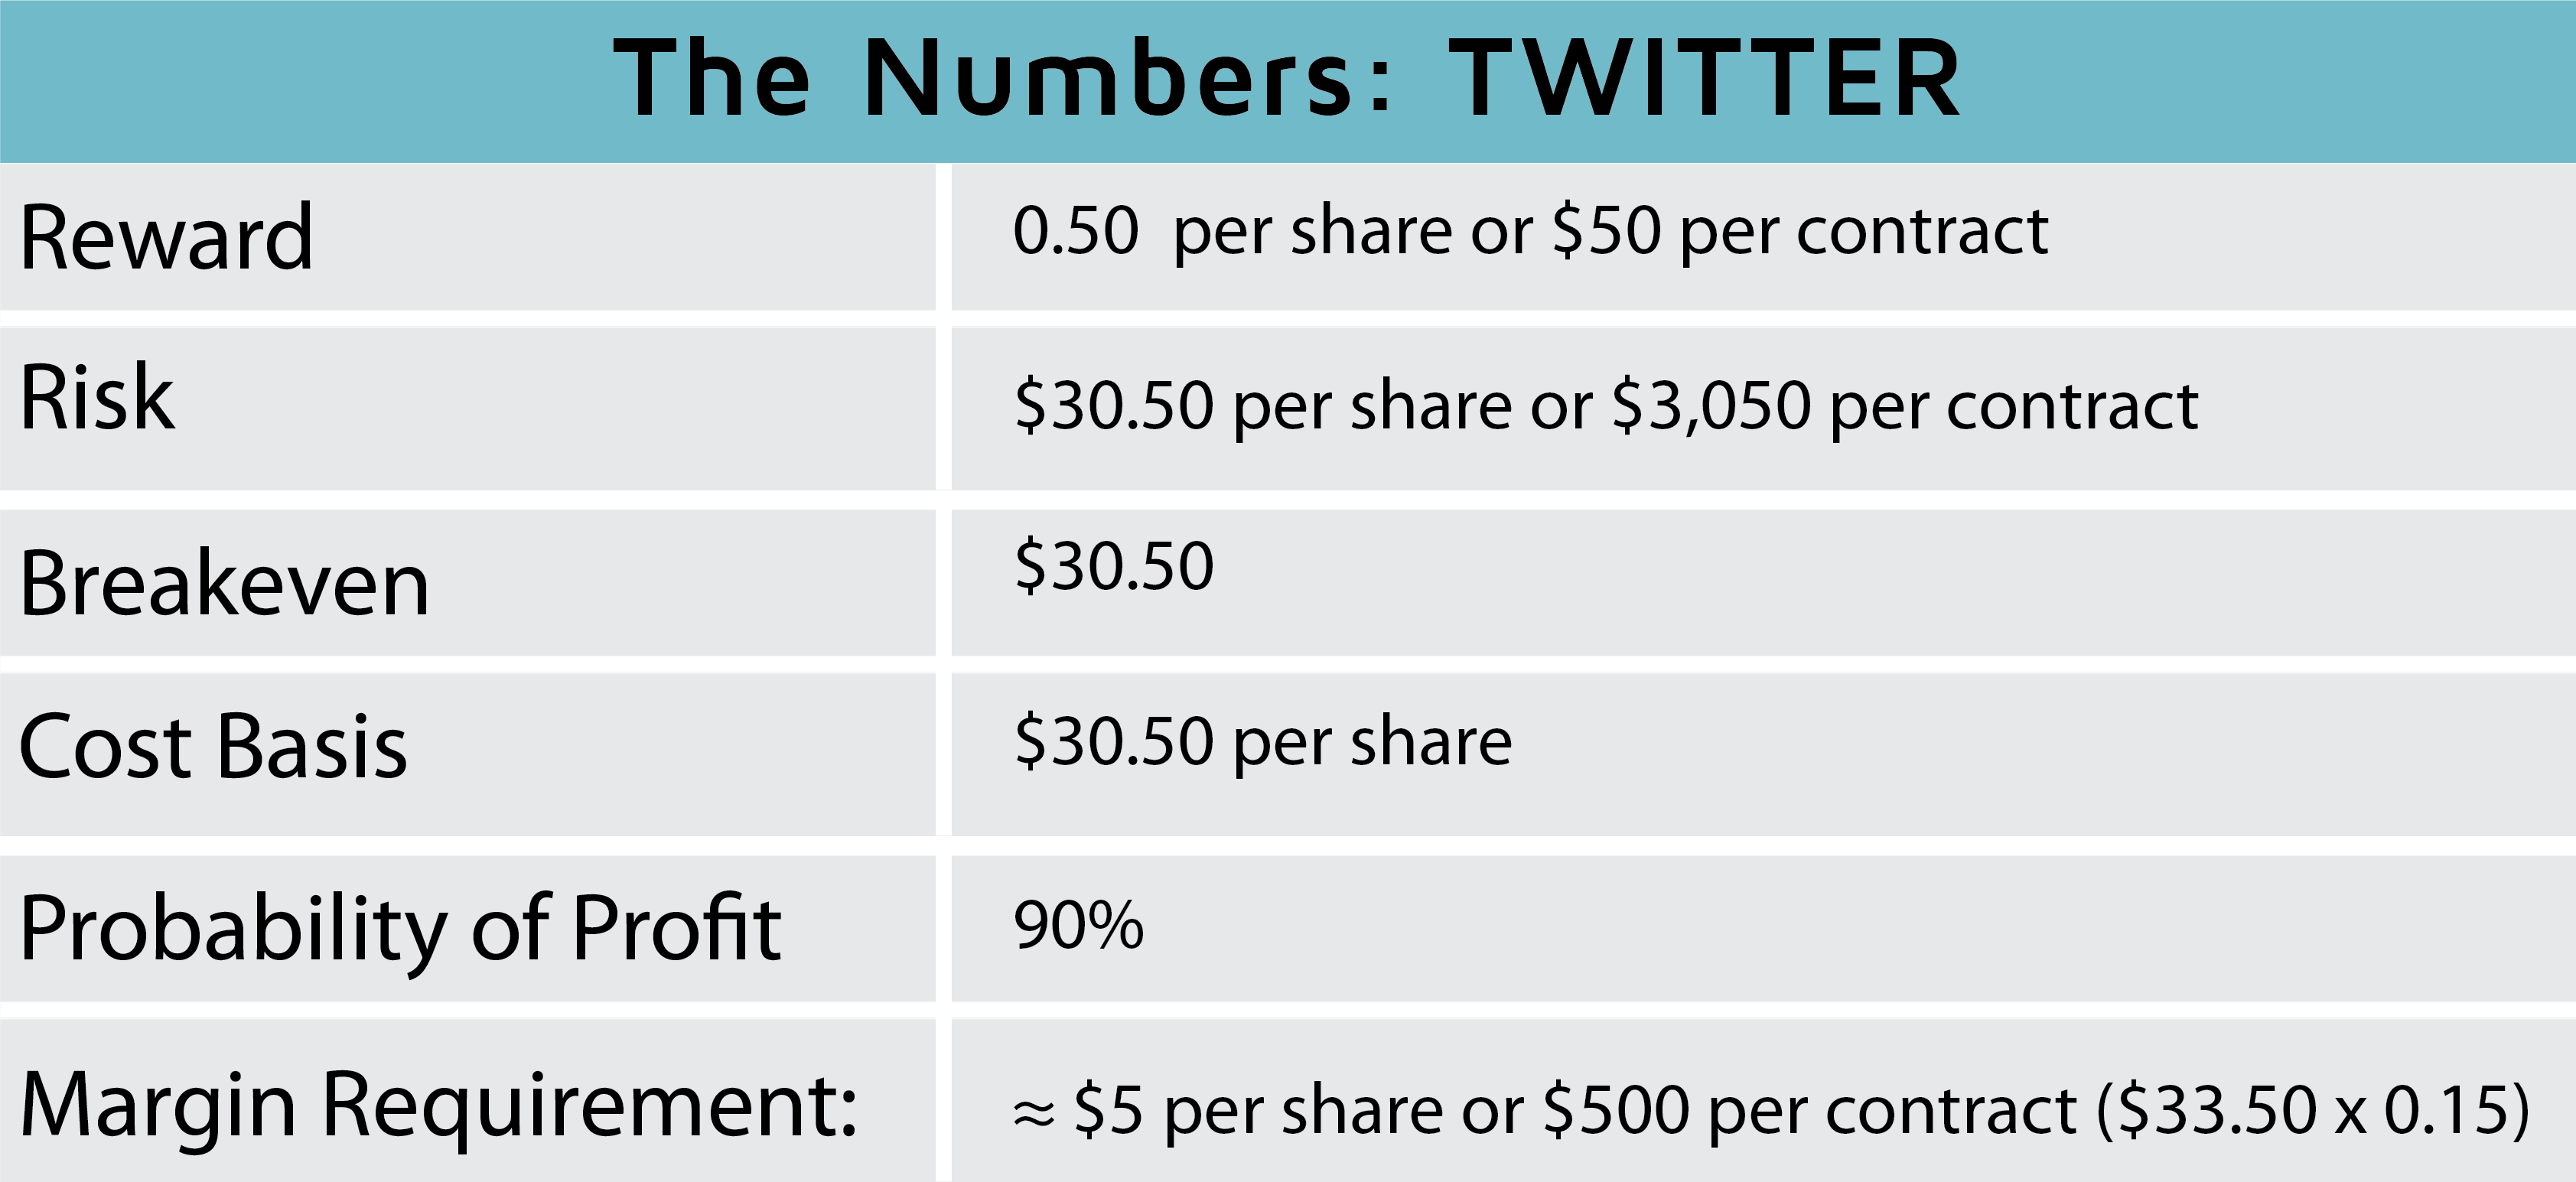
Let’s think through each formula. First, the maximum reward of 50 cents per share will be captured only if Twitter remains above $31. That means the put needs to expire out-of-the-money. The maximum risk will only be incurred if Twitter were to fall to zero in the next month – a virtual impossibility. The truth is with proper trade management you’ll be long gone before your loss gets anywhere close to this. The breakeven and cost basis are identical to the max risk. Essentially, as long as TWTR sits above $30.50, you will capture some type of profit. Below $30.50 you will start to lose money at expiration.
To be clear, this means the naked put is a high probability neutral to bullish strategy. It can even profit if the stock falls a little bit, just not too much.
Understanding the probability of profit requires you know something about the Greek delta. Just remember this relationship, the lower the delta, the higher the probability of profit. If you want to ensure your likelihood of success is greater than 80%, then you will always sell 0.20 delta puts. This speaks to the degree of control you have when establishing your position. Selling low delta, far out-of-the-money puts offers a higher probability but a lower reward. Alternatively, selling higher delta, close-to-the-money or even at-the-money puts offer a lower probability but higher reward.
As with all things in the trading world, you pick your poison. The final metric is the margin requirement or collateral required to place the trade. It needs a bit more explanation and is deserving of a separate section.
Naked vs. Cash Secured
Since we’re now moving into the topic of account types, it’s worth mentioning that some brokers don’t allow you to sell puts immediately. Because it is a more advanced strategy, it often requires you to get a certain level of trading authority before being able to use it. Check with your broker to see what is needed. If you have a margin account, then the cost of selling a naked put is typically between 10% to 20% of the stock price. That means if you’re selling puts on a $50 stock the margin required will be $500 to $1,000. On a $100 stock it will be $1,000 to $2,000. The exact amount will vary depending on which strike prices you select.
The beauty of having your broker only require a small percentage of the stock price is it increases the potential return on investment. In the case of Twitter, our max risk was $3,050, but the margin was only about $500. Since our potential profit was $50, that means the return on investment was modest 10% which is excellent for a naked put. Now, if the stock falls in value, the margin requirement can increase. This is why it’s imperative that you have some extra cash available in case the stock sours.
If you’re trading in an IRA account, the margin required for this strategy is different. By a lot. Because you can’t borrow against your retirement account, your broker will mandate you put up 100% of the max risk in the position. For the Twitter naked put, you would have had to put up $3,050 which really kills the potential return. Raking in $50 on a $3,050 investment drops the yield from 10% to 1.6%. You can see why traders are less enthused about selling puts in IRA accounts.
Higher Reward + Less Risk = Sign Me Up!
Since the naked put is a bullish strategy, we could view it as a substitute for buying stock. In fact, a side-by-side comparison of buying and holding a stock versus selling naked puts every month is perhaps the most effective way to identify its advantages. Fortunately, this exercise has already been done by the Chicago Board Options Exchange (CBOE). In June 2007 the CBOE began publishing data on the CBOE S&P 500 PutWrite Index. It can be tracked using the ticker symbol PUT. The Index is designed to measure the performance of a hypothetical portfolio that sells put options on the S&P 500 Index. I suppose this is a good time to introduce yet another synonym for the naked put, the put write. Sometimes traders refer to selling options as writing options.
Here is CBOE’s explanation for the Index:
“The PUT strategy is designed to sell a sequence of one-month, at-the-money, S&P 500 Index puts and invest cash at one- and three-month Treasury Bill rates.”
Because the Index holds aside sufficient cash reserves to cover the max loss of the position, it is technically tracking a cash-secured short put position. The investing of cash at one- and three-month Treasury Bill rates means it will accrue interest on the monies set aside. In case you were wondering, the current interest rate on these short-term treasuries is 1.7% and 1.9%, respectively.
Before diving into a chart of how PUT performed versus buying SPX, let’s identify what our expectations should be. First, we know buy-and-hold only makes money in up months. In contrast, the naked put profits in up, neutral, and even slightly bearish months. That means the PUT Index should outperform (make more money or lose less money) in all but really bullish months. The limited reward offered by the naked put means it will lose ground to buying and holding when the market rallies big.
To recap: in months where the market falls, moves sideways or rises slightly, PUT should deliver a better return. In months where it rises sharply, PUT will underperform (it will still make money, just not as much).
Here is a ten-year chart of PUT (gray line) versus SPX (yellow line). Study it for a moment and see if our assumptions held true.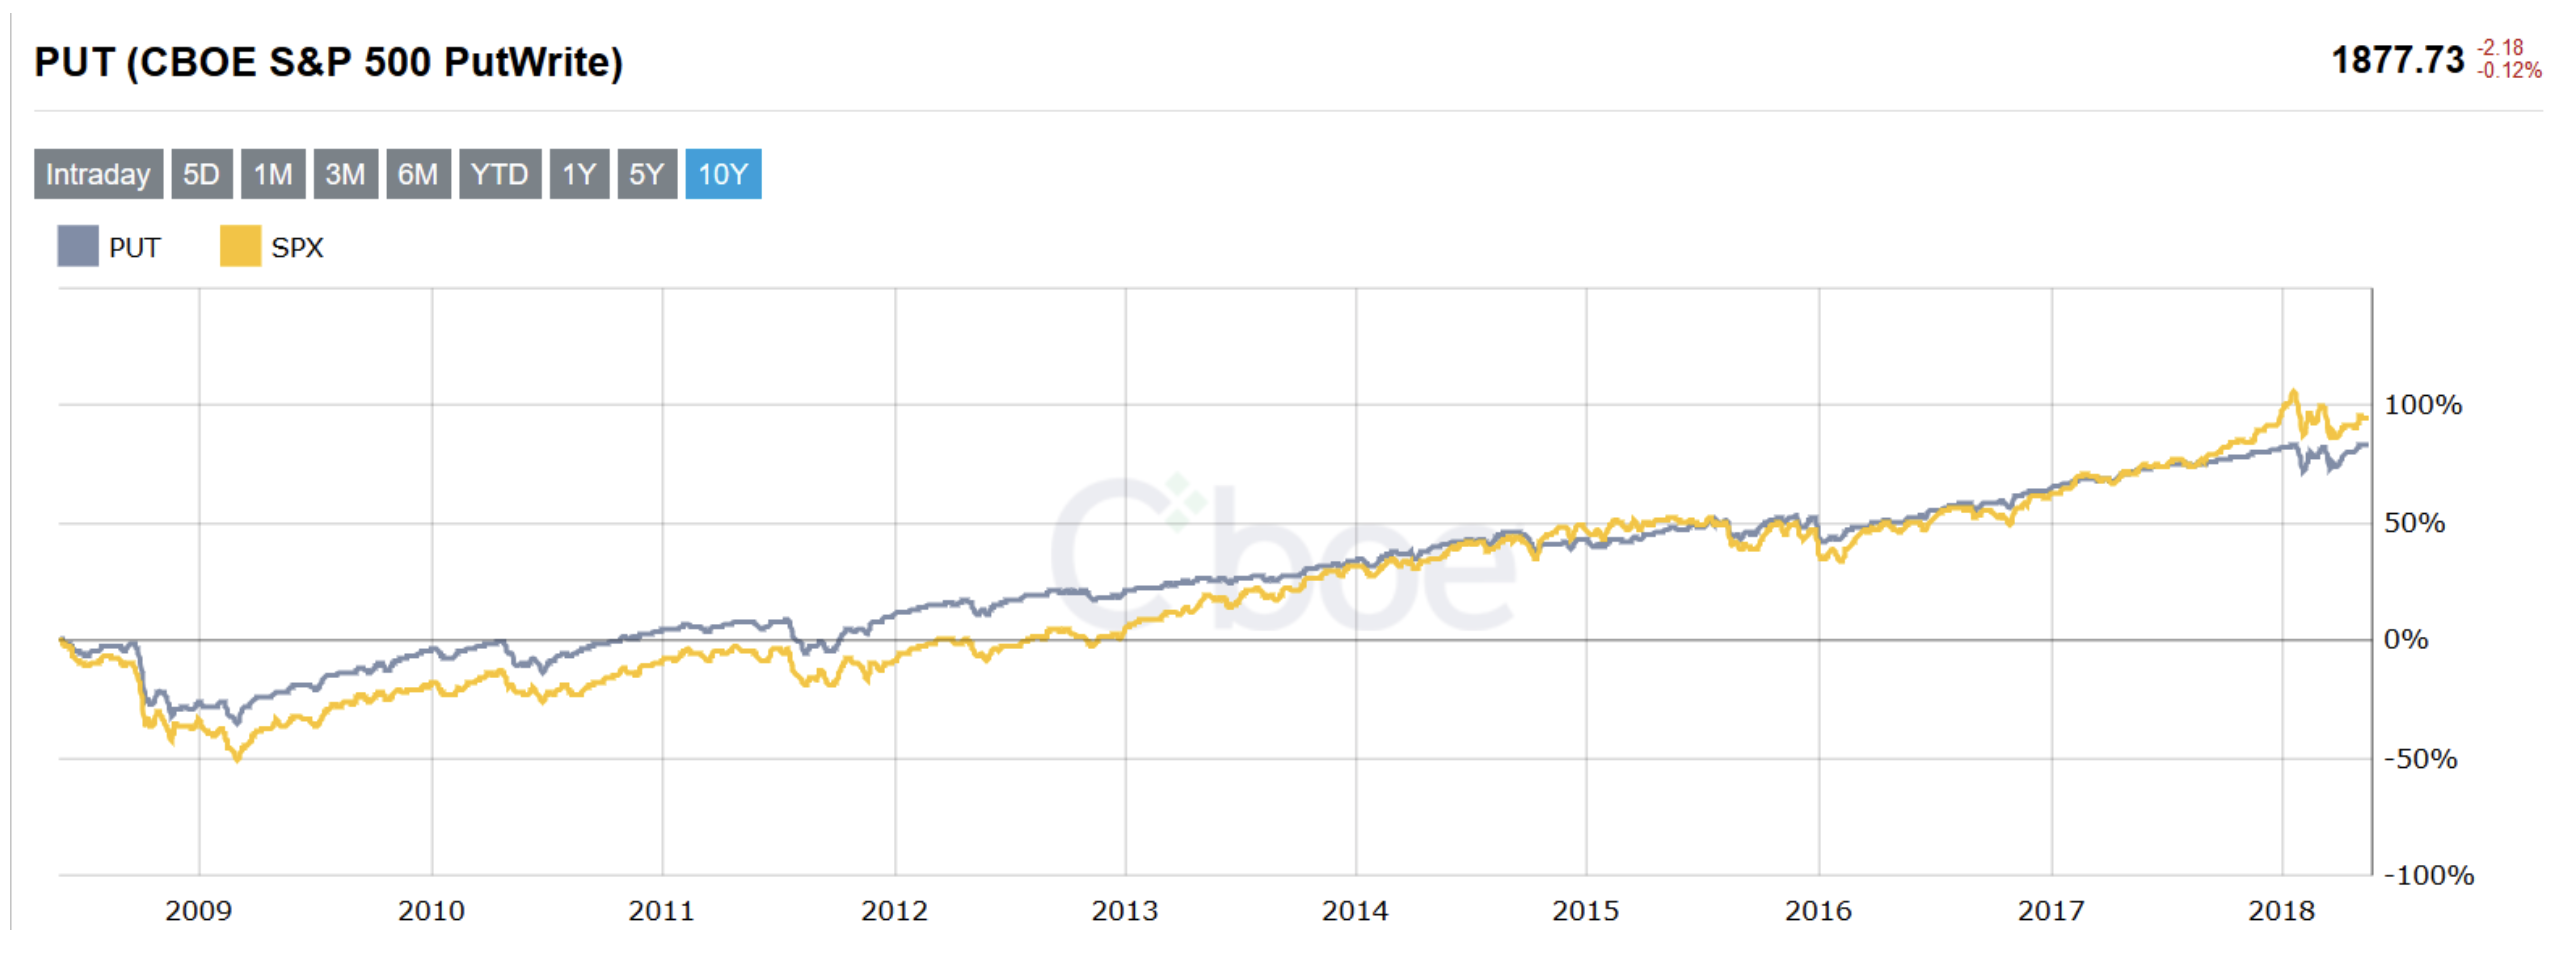
Here are the key takeaways:
First, do you notice how the gray line was less noisy than the yellow one? This means PUT was much less volatile than SPX. It offered a smoother ride to grow your money over the past decade.
Second, the gray line drops considerably less in 2008 and thus recovered back to even much quicker. That’s a win for the naked put strategy and shows how you do indeed outperform in down markets.
Third, the yellow line took the lead in late-2017 when the stock market melted higher illustrating how naked puts underperform when the market rockets higher. It’s not that you didn’t make money – you did. But you didn’t make as much money as if you were just long stock over the same time frame.
Skeptics may conclude that because SPX has grown more than PUT over the past decade, buy and hold is the way to go. We disagree. First, as any veteran trader will tell you obsessing about returns without thoughts of risk is foolish. Many view a strategy that generates slightly lower returns but with far less risk as superior. Second, over the past ten years, we’ve seen one of the best bull markets on record. Of course the naked put underperforms during such a bullish scenario. But do you think the next decade will be as epic as the last one? What of the one after that? In years where asset prices stumble or stagnate, the naked put strategy will catch-up and surpass that of buy-and-hold.
In fact, if we lengthen our lookback period for the comparison, the PUT Index beats the pants off of the S&P 500. To wit: since mid-1986 the total growth for PUT was 1,153%, but was only 807% for the S&P 500. And it did so, by the way, with about 30% less volatility than you would have been exposed to by buying and holding SPX.
Base Rules to Begin
Before we send you on your way, here are two basic entry rules to consider using at the beginning of your put selling adventures.
Rule One: Sell one- to two-month puts
45 days is the sweet spot. Selling short-term puts offers a higher rate of time decay plus less exposure to an adverse move in the stock. It’s easier to bet an asset will stay above a set price for a month than a year.
Rule Two: Sell a delta less than 0.20
The delta you select comes down to personal preference. Using a lower delta focuses on using the naked put as a cash flow strategy. If you’d prefer to shoot for more potential profit and use it as a substitute for long stock, then you might consider using a higher delta such as 0.30 to 0.50.
If you would like to save this content, you can do download its PDF format HERE