
In theory, asset prices are fluid. They ride on a sea of infinite participants, where supply and demand exist in unlimited quantities. The act of buying and selling is frictionless, which means nothing is hindering your ability to enter and exit at will – no transaction costs, slippage, or price gaps that create less than desirable fills. In such a world, prices might still move rapidly. But as they are zipping around, you can slip in and out with ease. It would be like driving on the world’s flattest road. Your smooth, comfortable ride would be free of unexpected jolts or bumps.
Unfortunately, the real world is a much more hostile environment than the fantasy outlined above. Wall Street is littered with potholes. If you’re not careful, your travels can quickly turn into a Hellish version of Mr. Toad’s Wild Ride at Disneyland.
While we’ve evolved beyond paying commissions on transactions (Yay for technological advances and competition!), we’ve yet to eradicate slippage and price gaps. Of the two, it is price gaps that are best represented by potholes. They come in varying shapes and sizes. While some are easy to see and avoid, others are hidden. The lion’s share of this month’s newsletter will be dedicated to identifying and naming the most popular gap formations. But we won’t just point out problems. We’ll provide some solutions as well. Just because we can’t avoid all gaps, doesn’t mean we can’t sidestep some of them. Furthermore, there are ways to protect yourself so that hitting the occasional crater doesn’t destroy your portfolio.
Before diving into the meat of price gaps, let’s define the other, more benign type of friction – slippage.
For the uninitiated, slippage occurs when your stop or market order gets filled at a worse price than expected. Say you input an order to sell Apple stock if it falls to $60. The next day, the naughty fruit tumbles below $60, and your order fills. But instead of exiting at the expected price, you didn’t get out until $59.90. The 10 cent difference between your order price and the actual fill price is known as slippage. It most often occurs when trading illiquid products or when volatility rears its ugly head.
So how do you avoid it?
Trade the most liquid products, which is measured by daily trading volume and bid/ask spreads. They’re easy to find. To start, build a watchlist of stocks that trade over a million shares a day. The higher the daily trading volume, the better the liquidity. You could also look at the bid/ask spread. The narrowest difference is a penny – as in, $10.05 by $10.06. The wider the spread gets, the more illiquid the stock. So stick with tickers that have tiny differences between the bid and offer. The same principles apply to options and futures as well.
What Causes Price Gaps?
Have you ever looked at a stock chart and seen blank spaces where prices seem to have skipped over? These are gaps and reflect times where no shares traded in a price range. Almost all of them occur overnight. That is, between one day’s close and the next day’s open. And, they can be an up gap or a down gap, depending on if prices are jumping higher or lower.
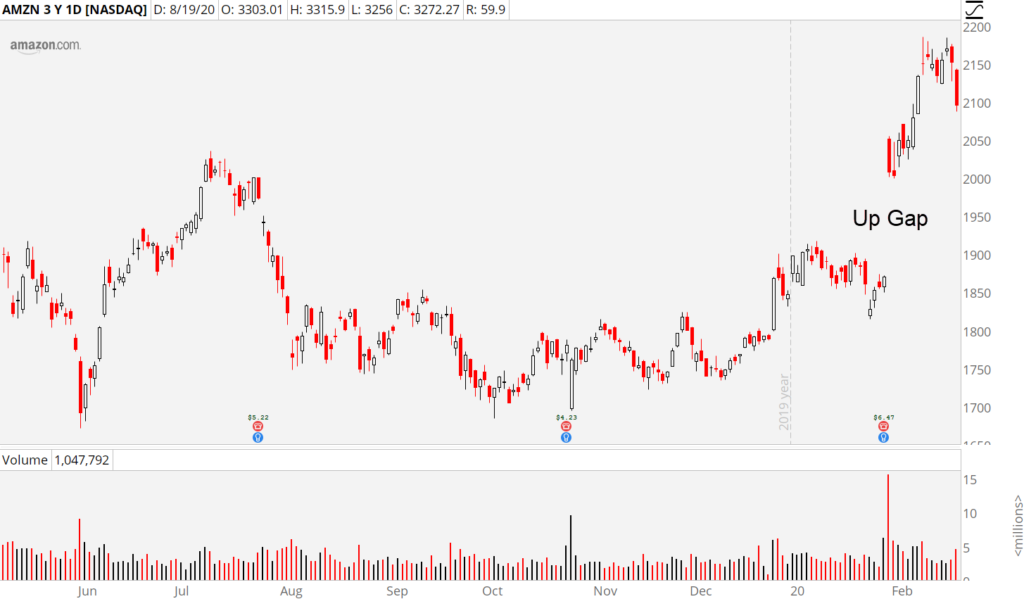
An up gap occurs if the low of the trading session that saw the price jump is higher than the high price of the previous day. That is what creates a blank space.
Here’s an example:
The down gap is created if the high of the trading session that saw the price jump is lower than the low of the previous day.
Here’s an example:
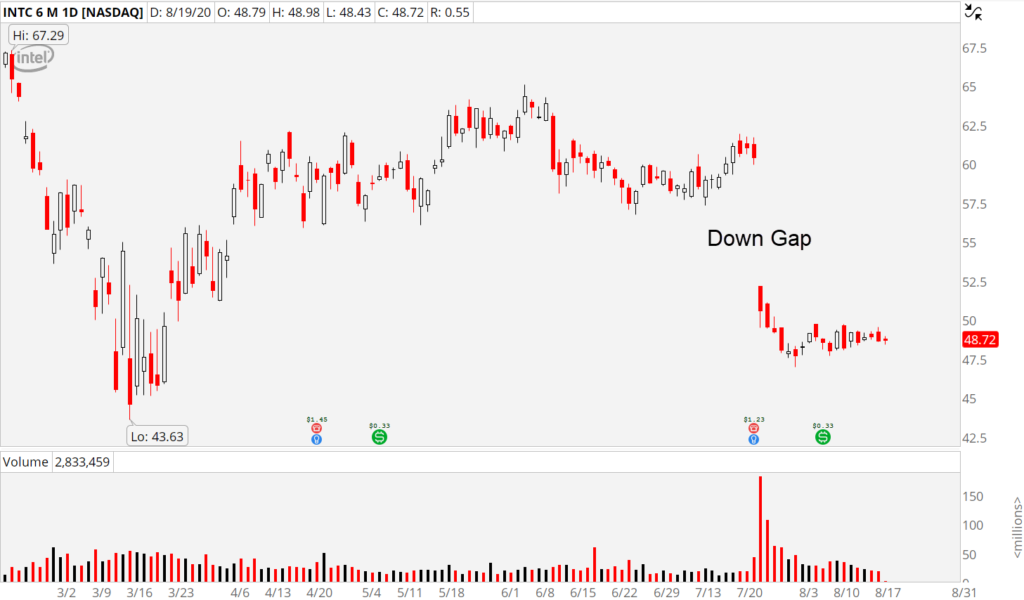
Gaps result from huge supply or demand coming into the market overnight. There is usually a spark that ignites the sudden buying or selling interest. The most common catalyst is the quarterly earnings report, but other unscheduled news events can cause these rapid shifts in sentiment. The Intel chart above is a good case study.
On July 23rd, its share price closed at $60.40 ahead of that afternoon’s earnings report. Due to underwhelming guidance and delays in its next-generation chips, a flood of sell orders hit the market overnight. To find enough buyers to absorb all the supply, prices opened the next day at $52.15, roughly 14% lower than the previous day’s close.
Gaps of this magnitude typically only occur when something dramatic has changed in the perceived value of the company. In this case, it was a hiccup in the company’s manufacturing that caused it to fall behind the competition. The market judged this as a major misstep likely to hurt its earnings for months and potentially years to come.
All gaps are not created equal. Some provide attractive trading opportunities, and others are best ignored. During the remainder of our newsletter, we’ll look at the characteristics of the four major gap categories: Common, Breakaway, Exhaustion, Catastrophic.
– Common (ignore me, I’m pedestrian)
-Breakaway (love me, I give profits)
-Exhaustion (The last gasp of a rally run ragged)
-Catastrophic (Oops, I killed the trend)
Common Gaps
As the name implies, these gaps occur the most frequently. As the least exciting of the bunch, they provide few, if any, chances for trading. Volume can be a useful indicator, signaling just how significant a gap is. Volume spikes usually accompany the most powerful (and trade worthy) gaps. This is something that common gaps typically do not see. Their size tends to be small, and they are usually filled relatively quickly.
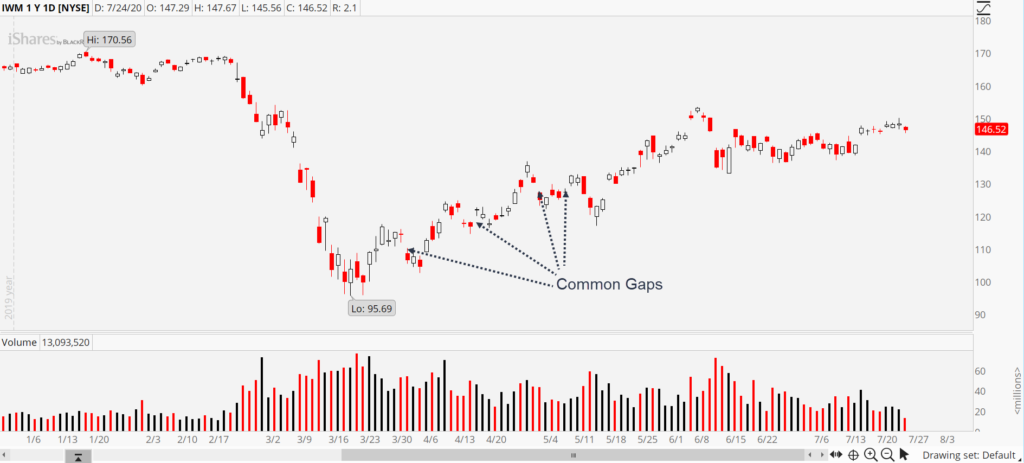
By “filled,” we mean the stock closes the gap by trading back to the previous day’s close at some point over the next few trading sessions. The four examples identified above created blank spaces that were filled within five subsequent candles.
It’s nice to know that common gaps are a part of the landscape, but they’re not actionable.
Breakaway Gaps
Picture a convict locked away in Federal Prison. He’s a limber escape artist. After toiling in his cell for a few weeks, he springs his plan. Upon exiting the compound, does he loiter? No! He flees like a bat out of Hell.
Stock charts are littered with prisons. We call them “consolidation” or “trading ranges.” Breakaway gaps occur when prices escape. They’re exciting and actionable – the anti-common gap if you will. Think of the dynamics driving a trading range. Prices are stagnant for a spell. Equilibrium rule the day with buyers and sellers at a stalemate of sorts. The longer the standstill lasts, the more significant the support and resistance zones which define it become. Consolidation zones come in many different forms, but high bases and triangles are probably the most common.
The breakaway gap occurs when we break out of the zone. It requires enthusiasm or fresh momentum to disrupt the stalemate. Either buyers finally defeat sellers, and we breach the topside of the range or sellers overwhelm buyers, and we break the lower end.
What makes this different than a garden-variety breakout is the range break occurs as a gap.
Typically, volume increases substantially on the break as confirmation of the newfound momentum. It’s also a byproduct of traders caught on the wrong side running for cover. In the case of an upside breakout, this would be short sellers rapidly buying to cover. With a downside break, it would be longs getting stopped out. The higher the volume, the more likely the breakaway gap sticks. In other words, don’t expect the gap to fill any time soon (if ever!).
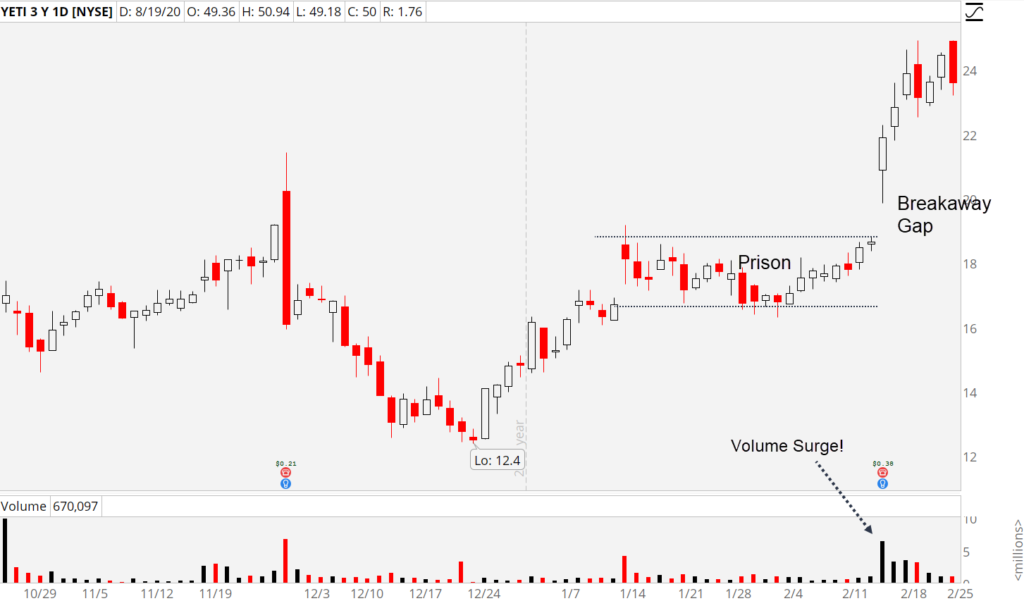
We’ll explain the standard trading techniques surrounding an upside breakout. You can use the inverse of them if the break comes to the downside.
For triggering into a long position, most traders look to buy when the stock trades above resistance. Since this occurred immediately at the open of the gap day, then you could buy at the open. If you’re trying to enter after the open, then consider either (a) using a break of intraday resistance or (b) waiting for the session to close and then using the high of the breakout candle to trigger in on the next day.
Runaway Gaps
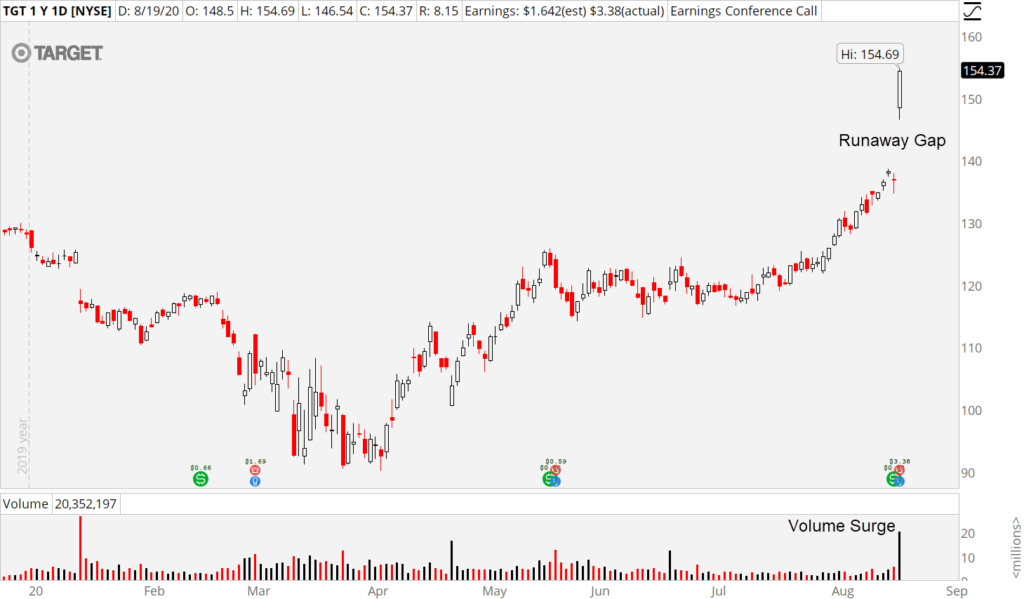
Runaway gaps are a close cousin to the breakaway gap. Instead of occurring when prices break out of a trading range, the runaway gap usually strikes when prices are already trending. They are sparked by a sudden uptick in interest and cause the rally (or decline) to accelerate substantially.
Once again, the catalyst is often a news event such as earnings or perhaps an analyst upgrade/downgrade. Volume will surge to confirm the power behind the gap. In the chart example below, you’ll notice Target was already advancing before the gap. Then, due to an epic beat on earnings, the stock suddenly jumped to open well above the prior day’s close. And traders have been chasing it higher ever since.
Exhaustion Gaps
As the name implies, exhaustion gaps occur at the end of an upswing. Consider it a byproduct of all the late-to-the-party-Charlies piling in at the top. Volume surges to reflect the mass influx of buyers. Unfortunately, it turns out to be the last gasp of an exhausted trend instead of the start of fresh buying.
At first, it may appear like a runaway gap, but the rapid reversal (usually over the next few days) puts the case of mistaken identity to rest.
Of course, exhaustion gaps can also occur at the end of a downswing or downtrend. They are the bearish version of everything mentioned above and usually signal capitulation. Think of it as beleaguered buyers finally pulling out a white flag and surrendering by puking up their shares in disgust. The bearish version of the exhaustion gap is more common due primarily to the fact that in all but the most extreme cases, downtrends are temporary.
Catastrophic Gaps
Our final variation is the rarest of the bunch. The catastrophic gap is always a byproduct of earth-shattering, perception-altering news. Usually, this arrives in the form of a dreadful earnings report. Sometimes, however, it comes in response to fraud or the discovery that management has been cooking the books.
In all cases, these are the gaps that have lasting effects. If often takes months, if not years, to fill the gap. Join me on a trip back in time to view the same Target chart above but in late-February 2017. The ubiquitous retailer reported worse-than-expected earnings and promptly fell 14% overnight. Rather than snapping back, price continued plumbing the depths, ultimately turning TGT into a dead-money stock for the next nine months.
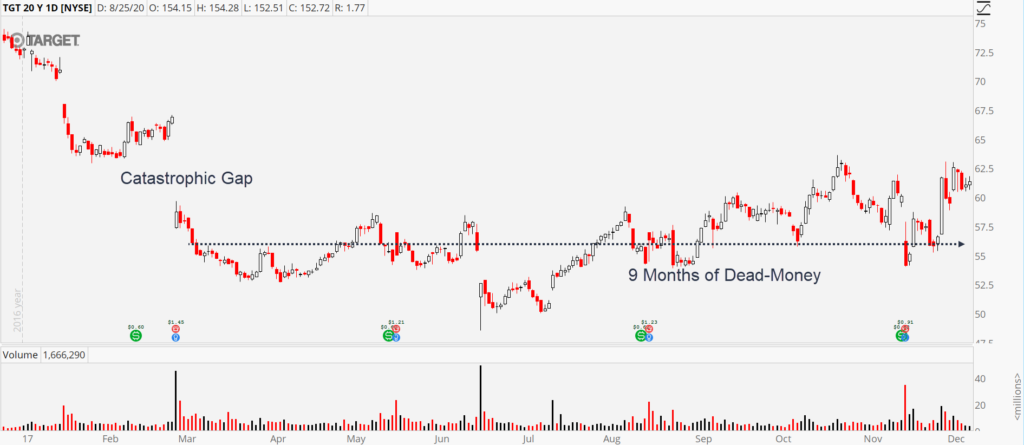
Fortunately, the company eventually overcame the downshift in business that hampered prices and rose to new records. Not all catastrophic gaps have such a happy ending. The Enron’s and Bear Stearns of yesteryear saw multiple disaster gaps like these on their way to the graveyard.
The main trading takeaway when you see a formation like this is to recognize the bearish sentiment is likely to linger. Look for continuation patterns after the gap to provide lower-risk entry points.
The Curious Case of ADRs
Have you ever seen a stock chart that seemed to gap every single day? They’re out there. The so-called gapping disorder could be caused by one of two things. First, it could be a low volume, thinly traded stock that jumps around due to the lack of liquidity. Second, it could be an American Depository Receipt, or ADR, for short.
A few examples of the more popular ADRs are Toyota Motor (TM), Taiwan Semiconductor (TSM), and Honda Motor (HMC). Do you notice anything similar among the three companies? They’re all foreign. Investopedia defines an ADR as “a certificate of ownership of a number of shares in a company that trades on a foreign exchange.” It allows U.S. investors to purchase shares in a company domiciled in another country without having to go to that country’s stock exchange.
Here’s where the frequent gaps come in. Toyota Motors’ common shares trade on the Tokyo Stock Exchange. Because Japan is on the other side of the world, its market is open when ours is closed. If Toyota Motors’ stock price changes dramatically during Tokyo’s session, then the ADR for Toyota has to gap up or down when the U.S. exchanges open to play catch-up.
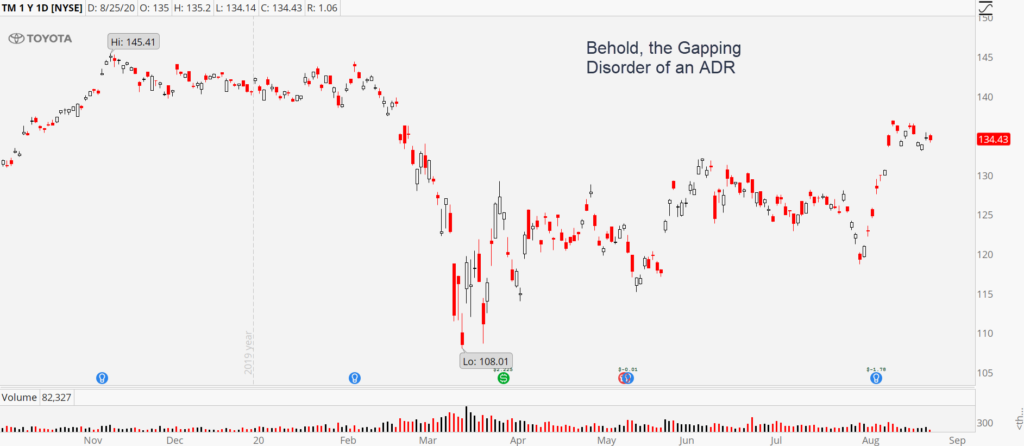
This makes swing trading the likes any ADR challenging. Jumping up or down 50 cents or dollars above or below your entry and exit points can derail your whole plan. That said, if you want to invest in an ADR for a long-term position, then the daily gaps aren’t near as much of a nuisance.
High VIX Regimes
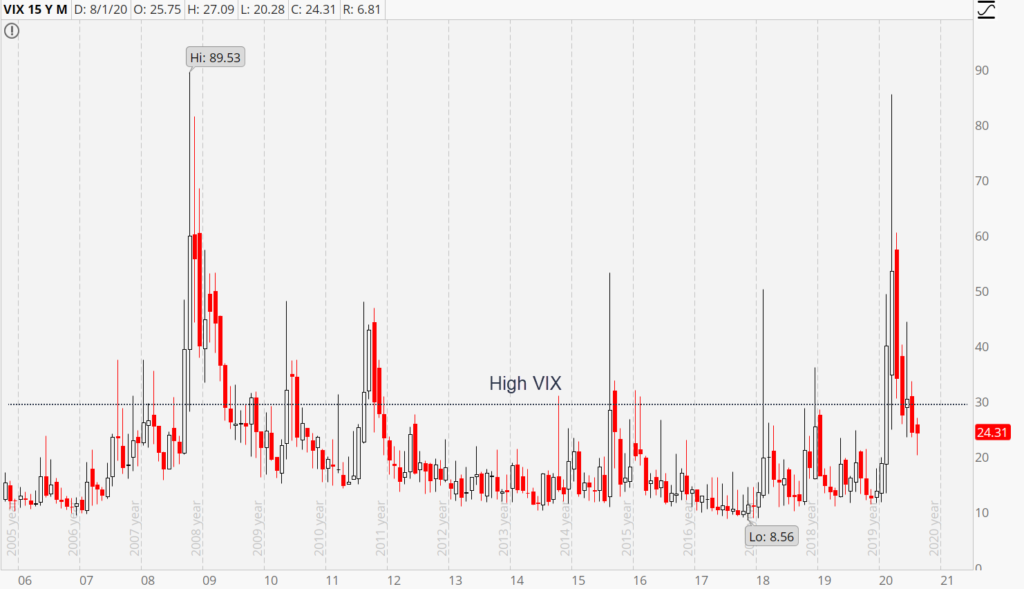
We mentioned earnings reports and random news events as the usual catalysts for gaps. But another force bears mention: volatility. If you haven’t noticed already, the volatility of stock prices moves in a cycle. Periods of low volatility eventually give way to spurts of high volatility, and vice versa.
When we’re in an elevated volatility stage, gaps become commonplace – regardless of individual stock news. The correlation between stocks rises, and everything flies or dives together. When chaos reigns and prices are flip-flopping every day, it usually pays to treat all gaps as common gaps. That means they’re generally not trade-worthy. Unless you’re playing for a gap fill on Index ETFs, but that’s a story for another day.
The CBOE S&P 500 Volatility Index, or VIX for short, is my preferred Index for gauging market volatility. Any spikes above the 30 level usually signal the transition into high volatility. The good thing about volatility, however, is it’s in your face and obvious. You’ll see it arrive just by watching the S&P 500 Index start hopping around like a jackrabbit each day.
The Remedy

Gaps can create profitable trading opportunities, but there’s no denying they’re an annoyance for existing positions. Like a thief in the night, they often arise unbidden and unannounced. Fortunately, there are a few things you can do to turn them from catastrophic career enders to minor irritants.
First, you can size small enough in your trades, so the occasional gap only delivers a flesh wound. Remember, gaps can cause prices to jump past your stop loss resulting in a larger drawdown than expected. Trading with a smaller position can minimize the impact.
Second, you can avoid holding stocks into events known to cause gaps like earnings reports. These can be the ultimate widowmakers, so sidestepping them entirely when using short-term directional trades is wise.
Legal Disclaimer
Trading Justice LLC (“Trading Justice”) is providing this website and any related materials, including newsletters, blog posts, videos, social media postings and any other communications (collectively, the “Materials”) on an “as-is” basis. This means that although Trading Justice strives to make the information accurate, thorough and current, neither Trading Justice nor the author(s) of the Materials or the moderators guarantee or warrant the Materials or accept liability for any damage, loss or expense arising from the use of the Materials, whether based in tort, contract, or otherwise. Tackle Trading is providing the Materials for educational purposes only. We are not providing legal, accounting, or financial advisory services, and this is not a solicitation or recommendation to buy or sell any stocks, options, or other financial instruments or investments. Examples that address specific assets, stocks, options or other financial instrument transactions are for illustrative purposes only and are not intended to represent specific trades or transactions that we have conducted. In fact, for the purpose of illustration, we may use examples that are different from or contrary to transactions we have conducted or positions we hold. Furthermore, this website and any information or training herein are not intended as a solicitation for any future relationship, business or otherwise, between the users and the moderators. No express or implied warranties are being made with respect to these services and products. By using the Materials, each user agrees to indemnify and hold Trading Justice harmless from all losses, expenses, and costs, including reasonable attorneys’ fees, arising out of or resulting from user’s use of the Materials. In no event shall Tackle Trading or the author(s) or moderators be liable for any direct, special, consequential or incidental damages arising out of or related to the Materials. If this limitation on damages is not enforceable in some states, the total amount of Trading Justice’s liability to the user or others shall not exceed the amount paid by the user for such Materials.
All investing and trading in the securities market involve a high degree of risk. Any decisions to place trades in the financial markets, including trading in stocks, options or other financial instruments, is a personal decision that should only be made after conducting thorough independent research, including a personal risk and financial assessment, and prior consultation with the user’s investment, legal, tax, and accounting advisers, to determine whether such trading or investment is appropriate for that user.
