
Over the years, I’ve received thousands of questions about trading concepts from my students. Recently, I received a question on how to determine if a portfolio is too bullish or bearish. There’s a video at the bottom of this post that explains everything there. If you want to skip straight to the video, scroll down.
How much risk is too much? That’s impossible to answer. It’s like asking, how fast is too fast? It requires context. Driving a car, 65 MPH on a Freeway is different than driving 65 MPH through your local elementary school parking lot. It is also different than driving on a raceway. Speed, without context, doesn’t tell us anything. Delta, and risk, without context, also doesn’t tell us much. You have to learn to assess your risk, relative to your portfolio and market posture. This blog is intended to help you do that through tools in the Analyze Tab, inside the Thinkorswim software, in a Paper Trading Account.
This is an important question. Learning how to assess, and manage, the risk is one of the most important skillsets any investor can build.
A portfolio is simply the accumulation of all of the trades and investments a trader builds. Consider a portfolio using the following strategies:
- Long Stocks
- Short Stock
- Covered Call
- Naked Put
- Vertical Credit Spreads
The above portfolio, combining Equity and Options, is a common portfolio for a trained and educated investor to build. The question, how much risk is there in this portfolio? Is something we can start to answer through advanced analysis.
Delta measures the sensitivity of price moving for a position. So, more delta means that a trade will make or lose more money as the underlying instrument moves.
A portfolio’s delta total is best measured through a process called Beta Weighting a portfolio. The coaches at Tackle Trading, including myself, have written and recorded a lot of content on this topic.
Review some of the information here:
This is extremely valuable information if you know how to use it. When looking at a portfolio, in a platform like Thinkorswimm positive Delta means the trade is bullish and the investor wants the price to rise over time, negative Delta means the trade is bearish and the investor wants the price to fall over time.
Measuring Portfolio Risk
If you add up all of your trades, all of the capital you’ve invested and put it in one basket, that basket can reflect the overall weight of your positions. You can do this in several ways, but one great way to do it is inside the Analyze tab tool in Thinkorswim.
Steps to take:
- Locate all of your trades and investments by symbol, quantity, and price.
- Open the Analyze Tab in Thinkorswim
- Build each position, one at a time, entering the symbol and recreating your trade as a simulated trade
- Change the view of the tool to ‘Portfolio Beta Weighted’ and ‘Hide Positions’
- Add ‘Price Slices’ and build in different scenario’s of price movement to reflect upward and downward price movement
- Change the view to Risk Profile so that you can see the risk graph
- Assess your portfolio design, and risk, based on the scenarios in the price slices. Determine how much risk you’re taking relative to your portfolio totals.
- Adjust your portfolio design if needed, to take less risk, or more risk, as you see fit.
Example of How To Enter your Investments and Trades one at a time
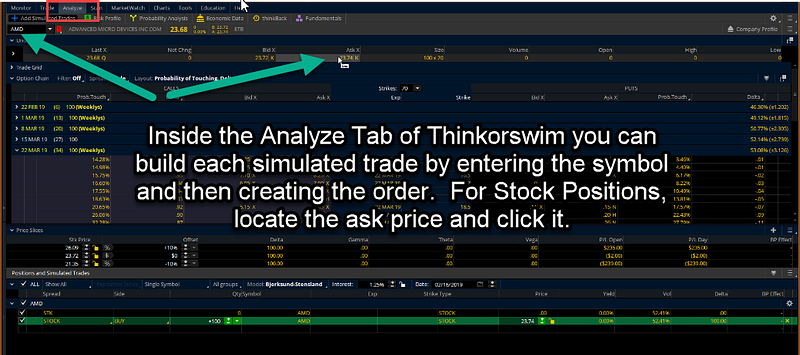
AMD simulated trade in the Analyze tab in Thinkorswim. To simulate a stock trade, enter the symbol, and then locate the bid or ask on the line labeled ‘Underlying’
Once you go into the Analyze tab, you can add the positions one at a time by entering the symbol and then building each trade. For stock trades, locate the bid or ask price and click appropriately. For options trades, you will need to create them within the ‘add simulated trades’ button and inside the option chain.
For Options Trades, locate the appropriate Expiration and Strike to add them in one at a time
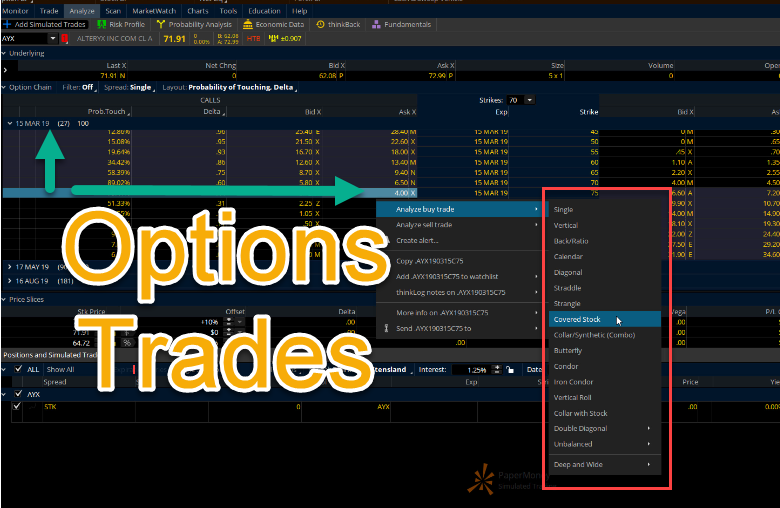
AYX Covered Call simulation. To enter an options trade, locate the expiration and strike you wish to trade, and then right click to access the menu above. Select the appropriate ‘Analyze Buy Trade’ or ‘Analyze Sell Trade’ for your particular position.
Once you’ve entered All of your Trades Filter for ‘Hide Positions’ and ‘Portfolio Beta Weighted’ to assess your overall portfolio risk
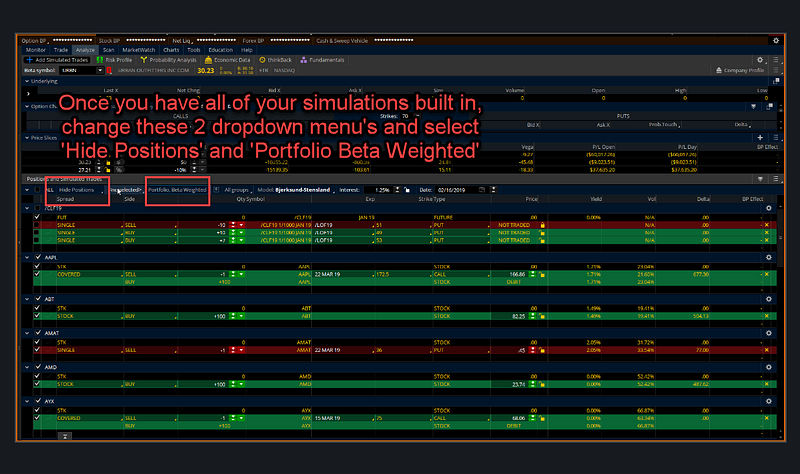
After you’ve gone through each position you need to enter, one at a time using the Single Symbol interface inside the Analyze tab, you then can assess your overall portfolio risk.
Beta Weight against the instrument you want to measure against, SPY is a common choice
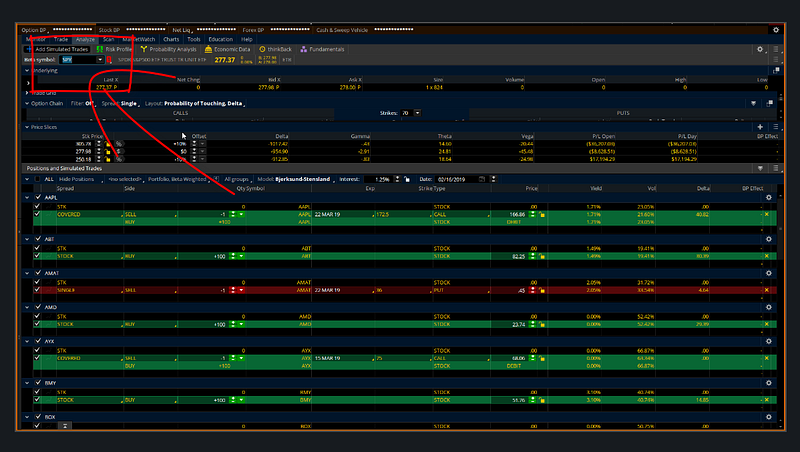
Now that you have all of your positions built into the Analyze Tab, you can now start to measure your portfolio risk against SPY (or any other instrument). This is incredibly valuable to be able to get this kind of information. It will help you determine how much risk you’re taking and start to map out scenarios of market movement and how they will impact your bottom line.
After you’ve built all of your portfolios into the Analyze tab, you can then beta weight the portfolio to better assess and understand your risk profile.
The most common Beta Weighted symbol to use is the SPY. You can beta weight to any other instrument you want. The reason many traders use the SPY is that it is the S&P 500 ETF which tracks the broad market. By measuring against SPY, you can now assess your risk in your positions against the theoretical risk of the SPY going up or down.
So, if the market goes up 4% how much money will you make or lose? If the market goes down 4%, how much money will you make or lose in your portfolio? You should be able to estimate that, using advanced tools like these I’m showing you here.
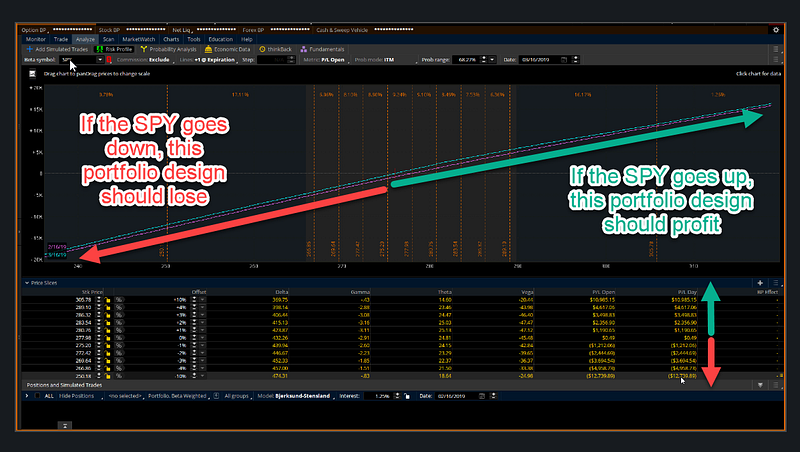
And this is how you analyze your risk, against movements in the SPY market, in the Analyze tab in Thinkorswim.
So, what do you do with the information? That’s up to you. Knowing how much you are estimated to make or lose as the market’s move is valuable. But, now you have to tie it back into your portfolio design and system.
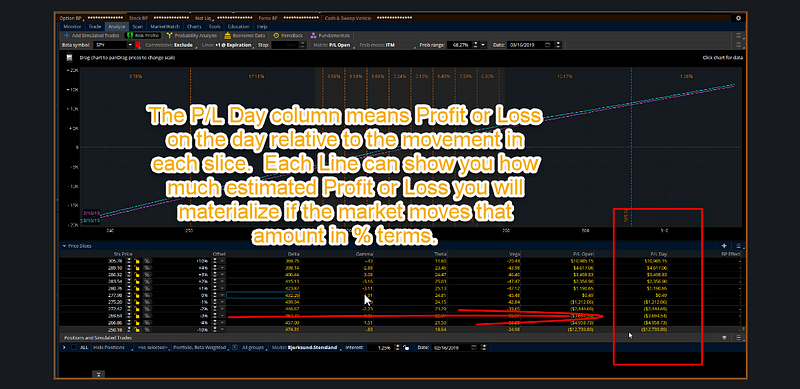
No one, but you, can tell you how much risk you should take and how much you are comfortable with. There are some general guidelines portfolio managers use, like assessing the percentage risk they are taking against their portfolio. If the market moves 4% and you lose 10–20% of your capital, you are taking more risk. If the market moves 4% and you are risking 1% of your capital, you are taking less risk. The exact amount you should take has to be determined by you as the trader.
This tutorial is intended to help you learn how to use these tools.
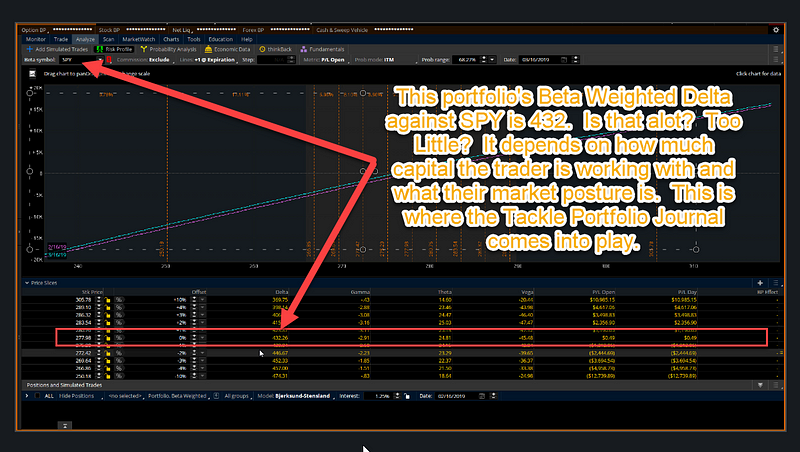
So, is this portfolio too bullish? There are some tools to help us measure this, and answer this question mathematically.
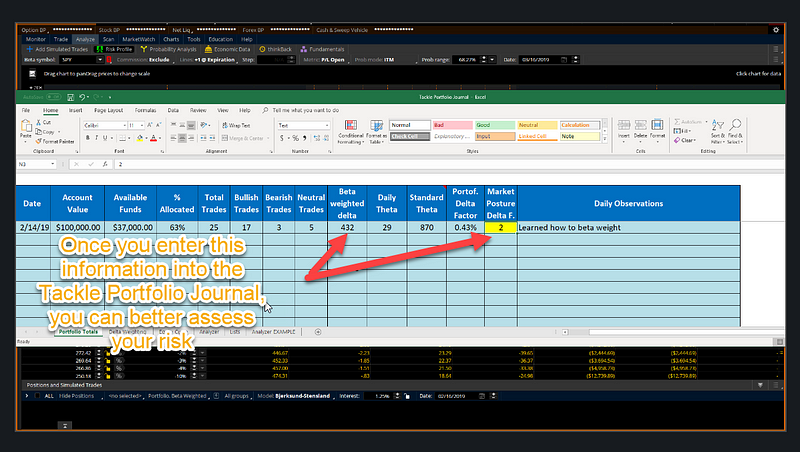
The first thing that has to be determined, is the market bias of the trader. This is a numerical representation of subjective opinion. In essence, using a scale like the Tackle Trading Coaches do in the weekly newsletter, you would rank your Market Posture. The more bullish you are, you would state that by saying you are a +1 +2 or +3. The more bearish you are, you state that by saying you are a -1 -2 or -3. These numbers tie back into the basic idea of a bell-shaped curve. Using that concept, most of the time, it’s appropriate to be -1, 0 or +1. When you move into +2 or +3 or -2 or -3 you are essentially saying ‘I am more confident that the markets are Bullish or Bearish’
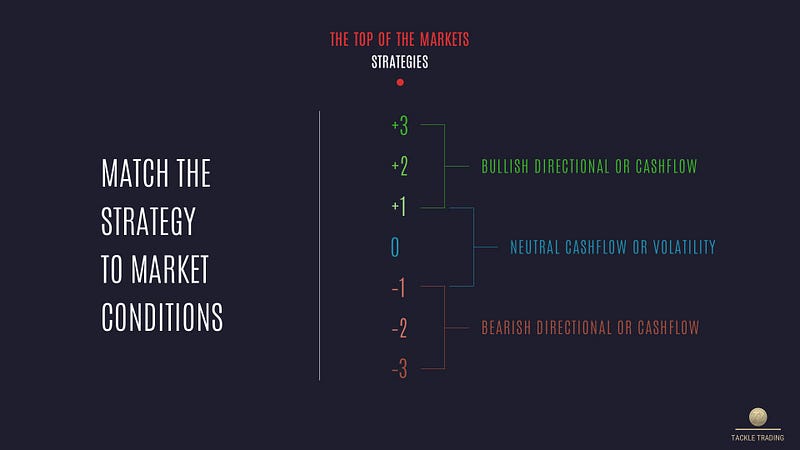
What we’re doing here, is essentially trying to turn our opinion into a defined mathematical answer.
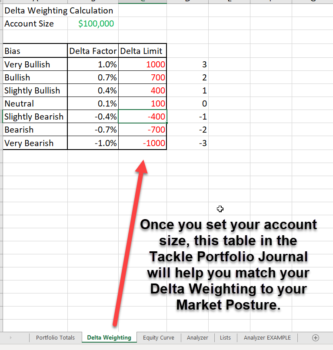
Inside the journal, the second tab is titled ‘Delta Weighting’. Here, you can enter your portfolio size and see some information about what levels of Beta Weighted Delta reflect your underlying Market Bias.
So, is this hypothetical portfolio too bullish? That’s not for me to answer. At the end of the day, only the trader can determine how much risk they want to take. But, the design of this portfolio does have a bullish bias and will have profit build if the market moves up. The key question I would have for any trader, any investor and anyone reading this blog. What will you do if the market drops? Do you have an insurance plan in place? Stop losses? Do you know how to hedge? These are important skillsets to build. Risk assessment and risk control are the most important skills, in my opinion, to develop as a trader and investor. If you don’t know how to control the risk, I would prioritize building the skills to do so, in Paper Money, and long before you ever start live trading.
3 Things Every Investor Should Master:
- A Daily Routine
- Trading Systems
- Tools (like the Analyze Tab in this portfolio)
Resources:
Welcome to the Tackle Trading Store. Build your Tackle, your own way.tackletrading.com
Any investor can survive stock market crashes by using The Bear Market Survival Guide because it includes Wall Street’s…tackletrading.com
Trading Journals are a must if you want to grow as a trader. They help you learn from your losses and repeat your wins…tackletrading.com
Tackle Trading is an online community for traders and investors who look to collaborate, share ideas, help each other…tackletrading.mn.co
Legal Disclaimer
Tackle Trading LLC (“Tackle Trading”) is providing this website and any related materials, including newsletters, blog posts, videos, social media postings and any other communications (collectively, the “Materials”) on an “as-is” basis. This means that although Tackle Trading strives to make the information accurate, thorough and current, neither Tackle Trading nor the author(s) of the Materials or the moderators guarantee or warrant the Materials or accept liability for any damage, loss or expense arising from the use of the Materials, whether based in tort, contract, or otherwise. Tackle Trading is providing the Materials for educational purposes only. We are not providing legal, accounting, or financial advisory services, and this is not a solicitation or recommendation to buy or sell any stocks, options, or other financial instruments or investments. Examples that address specific assets, stocks, options or other financial instrument transactions are for illustrative purposes only and are not intended to represent specific trades or transactions that we have conducted. In fact, for the purpose of illustration, we may use examples that are different from or contrary to transactions we have conducted or positions we hold. Furthermore, this website and any information or training herein are not intended as a solicitation for any future relationship, business or otherwise, between the users and the moderators. No express or implied warranties are being made with respect to these services and products. By using the Materials, each user agrees to indemnify and hold Tackle Trading harmless from all losses, expenses, and costs, including reasonable attorneys’ fees, arising out of or resulting from user’s use of the Materials. In no event shall Tackle Trading or the author(s) or moderators be liable for any direct, special, consequential or incidental damages arising out of or related to the Materials. If this limitation on damages is not enforceable in some states, the total amount of Tackle Trading’s liability to the user or others shall not exceed the amount paid by the user for such Materials.
All investing and trading in the securities market involve a high degree of risk. Any decisions to place trades in the financial markets, including trading in stocks, options or other financial instruments, is a personal decision that should only be made after conducting thorough independent research, including a personal risk and financial assessment, and prior consultation with the user’s investment, legal, tax, and accounting advisers, to determine whether such trading or investment is appropriate for that user.
