Think about how investors discuss the stock market. Sometimes they refer to what a particular stock is doing, like Apple or Amazon. Other times, they’re commenting on how the market in aggregate is performing.
It is the second approach that commands our attention today.
The financial media and traders all over the globe use stock indexes to follow the broad market. The S&P 500, Dow Jones Industrial Average, and Nasdaq are most often quoted on the radio or TV. Have you ever wondered where they came from? Given their prevalence and the weight we place on them, it can seem like they’ve always existed. But they haven’t. Indeed, the very idea of following a basket of stocks and using it as a barometer for the rest of the market wasn’t even around until the 1890s.
Today I want to tell the tale of Charles Dow. He was a pioneer who shaped modern markets by creating the Dow Jones Industrial Average, advancing technical analysis and founding the Wall Street Journal.
Along the way, you’ll learn three things:
One: how stock indexes work
Two: why buying them instead of individual stocks is the best way to invest
Three: why passive investing is actually active.
Meet Charles

Charles Dow was an American journalist born in Connecticut in 1851. After working as a city reporter and night editor, he migrated to New York City with a desire to be in the thick of business and financial reporting. He soon landed a job at the Kiernan Wall Street Financial News Bureau and invited his colleague, Edward Jones, to join him.
Dow and Jones witnessed a willingness of others to allow bias and outright bribery to sway their reporting. The pair shared a desire to avoid market manipulation and objectively report the facts. Rather than change the ethos of an existing company, they decided to start their own.
In 1882, Dow, Jones & Company was born as an alternate source to existing financial news bureaus. Their fledgling enterprise grew in popularity, and by 1889 the partners launched a newspaper titled Wall Street Journal.
Birth of the Dow Jones Industrial Average

To allow readers of the Wall Street Journal to better track and understand what was happening in the stock market, Charles Dow created the Dow Jones Industrial Average in May of 1896. Rather than only following individual companies, Charles reasoned that the average price of a basket of stocks would provide a more accurate representation of stock activity.
And he was right. It’s less time-consuming to track the performance of a single index than hundreds of individual stocks.
The initial basket included twelve industrial companies, and the formula was straightforward: add the closing price of all twelve stocks and divide by twelve. As the name suggests, it was literally an average of industrial companies. The fact that Charles focused on the industrial sector wasn’t a coincidence. At the time, those were the companies that dominated and best represented the American economy.
The original twelve stocks included in the Dow Jones Industrial Average are:
- American Cotton Oil Company
- American Sugar Refining Company
- American Tobacco Company
- Chicago Gas Company
- Distilling & Cattle Feeding Company
- General Electric
- Laclede Gas Company
- National Lead Company
- North American Company
- Tennessee Coal
- United States Leather Company
- United States Rubber Company
For over three decades, the number of components in the Dow remained the same. But in 1928, during the eve of the roaring twenties, the average expanded to cover thirty stocks. It’s a number that stands to this day. Simultaneously, the formula for calculating the average changed to use a continually updated divisor to adjust for membership changes, dividends, and stock splits.
You probably only recognize one of the original twelve companies: General Electric. The rest were acquired, merged with competitors, or went bankrupt along the way due to the creative destruction that has characterized America’s capitalistic system. The Dow Jones Industrial Average’s composition has evolved to remain relevant and representative of the current landscape. In fact, we’ve seen 60 changes over the past 125 years. Here are the last four:
- Removed: Exxon Mobil, Pfizer, Raytheon Technologies, and General Electric
- Added: Salesforce.com, Amgen, Honeywell International, Walgreens Boot Alliance
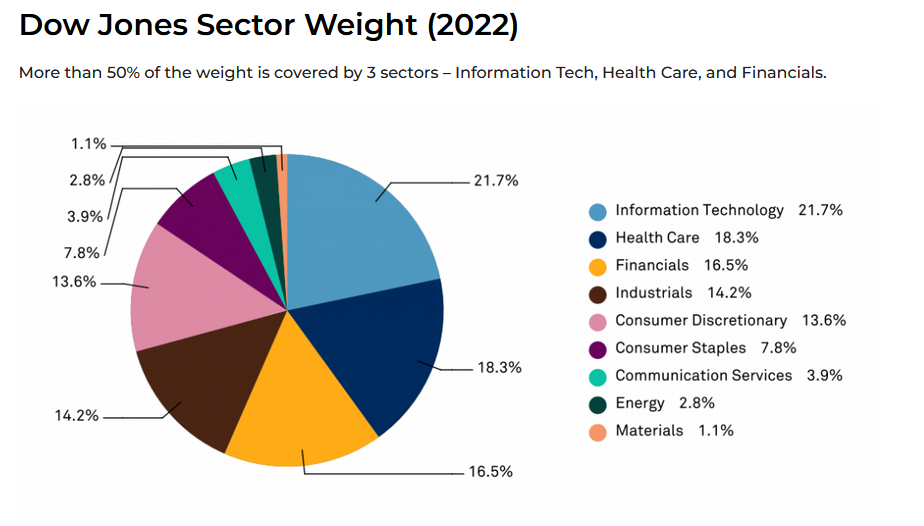
You can find a list of the thirty companies that currently comprise the Index here. Even though the name has remained the same, the modern-day version holds more companies outside the industrial sector than in. This is by design. The current economic landscape for the United States and the globe are dominated by technology titans, health care giants, and financial behemoths. Why shouldn’t an Average designed to represent the economy also be dominated by such? Here are the current sector weightings:

Competitors & Formulas
Other indexes with slightly different structures have since joined the Dow Jones. The S&P 500 was created in 1957 and includes 500 large companies. Some argue it’s more representative because of the broader basket, but ironically its performance has closely tracked the Dow over time. The Russell 2000 started in 1984 and includes 2000 smaller companies. Traders use it as a barometer for the health and performance of the little guys in the public arena. They tend to be more vulnerable in bear markets but offer the potential for more significant returns during bull markets. Finally, the Nasdaq Composite includes every stock listed on the Nasdaq exchange and is heavily weighted toward technology companies.
There are three common formulas used in creating an Index: price weighted, market-cap weighted, and equal weight.
The Dow Jones Industrial Average is a price-weighted index. That means the most expensive stocks exert the most influence on its performance. For example, UnitedHealth Group (UNH) is the highest priced holding at $480 and carries a nearly 10% weighting. On the other end of the spectrum, Intel (INTC) and Walgreens Boot Alliance (WBA) trade near $42 and account for less than 1% of the average apiece.
The S&P 500 is a market-cap weighted index, which means the largest companies make the most impact. At over $2.3 trillion, Apple is the biggest company in the Index and holds a 7.14% weighting. Of course, since 500 companies make up 100% of the Index, many of the smallest ones account for only a fraction of 1%. In other words, they don’t matter all that much.
Equal-weight Indexes are less popular, but the logic behind their construction makes sense. Each company carries the same weight and thus has an equal impact on the performance.
Why Buying Indexes is So Smart

With the advent of mutual funds and exchange-traded funds (ETFs), it became possible to buy an index instead of buying individual stocks (aka stock picking). For instance, you can purchase the entire S&P 500 or Dow Jones Industrial Average using SPY or DIA. This allows you to achieve diversification with a single purchase while ensuring you’re on the right side of creative destruction. As one who has been in the markets since 2006, I must admit this second perk is one that I haven’t fully appreciated or understood until recently. You don’t have to wait as long as I did. I’ll explain it to you right now.
First, as I hope you’ve gathered so far in this newsletter, market indexes change. The Dow Jones of today looks nothing like it did in 1896. If it did, the performance wouldn’t have been near as good. Not by a mile! Eleven of the original twelve companies don’t exist anymore. And the final holdout, General Electric, eventually did so poorly that it got the boot in 2018.
This illustrates a crucial point. Most companies don’t last. Throughout history, even the best eventually succumb to poor management, intense competition, technological change, or a shift in consumer preferences. In Scale: The Universal Laws of Life, Growth, and Death in Organisms, Cities, and Companies, Geoffrey West calculated that “of the 28,853 companies that traded on U.S. markets since 1950, 22,469 (78%) died by 2009.” What’s more, “half of all companies in any given cohort of U.S. publicly traded companies disappear within 10 years.”
Some veteran stock pickers might contend they can avoid many of the 78% of stocks that go to the graveyard by using fundamental and technical analysis. Moreover, the jarring statistic doesn’t apply as much to those with short-term time horizons. Nonetheless, if you’re looking to buy stocks for the long run, then doing so by picking your favorite companies is way harder than buying an index. The odds are stacked against you more heavily than you may realize.
If that weren’t enough reason, here’s another compelling statistic. Hendrik Bessembinder discovered in his research paper “Do Stocks Outperform Treasury Bills?”: “The best-performing 4% of listed companies explain the net gain for the entire U.S. stock market since 1926.”
It’s unbelievable. Over the entire 90-year span from 1926 to 2016, just 4% of stocks generated all of the excess return for the equity market above T-bills. Let me say it a different way. 96% of the stocks in the market that you could have purchased performed no better than if you simply put your money in a high yield savings account that paid you the same amount as Treasury bills.
How confident are you that you would have selected the few stocks that belong to the 4%?
Passive Investing is a Mirage
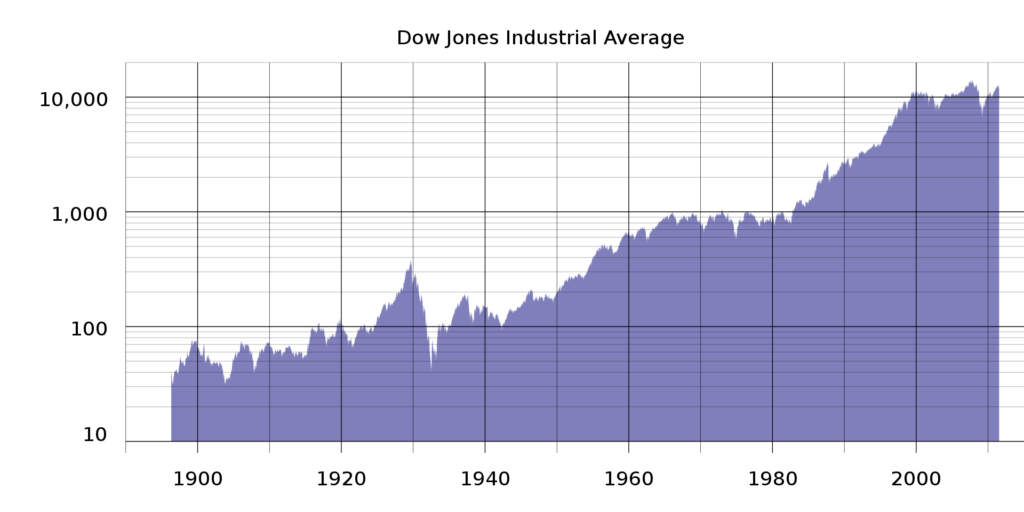
Some people characterize buying and holding an Index as “passive investing.” It implies you’re not jumping from one stock to another. Instead, you’re purchasing a diversified bucket of many stocks to remove company-specific risk. But here’s the thing. The bucket’s composition isn’t static. It changes all the time. The reason the Dow Jones Industrial Average has climbed approximately 10% a year on average since inception is not because Charles Dow succeeded in picking the 12 companies that ended up dominating the world over the next century. It’s because the committee that oversees and decides which companies comprise the Index has done an admirable job of keeping the holdings relevant.
And it’s not just the Dow Jones that evolves. A committee at Standard & Poor’s investment company selects the companies in the S&P 500. According to Sam Ro, “Since January 1995, 728 tickers have been added to the S&P 500, while 724 have been removed.”
That’s a lot of movement!
The biggest reason a stock gets removed from the Index is that it underperforms for an extended time. By design, the Dow Jones and S&P 500 track large-cap stocks. And, well, market capitalization is a function of the share price. If a stock falls too far, it may no longer qualify as a large-cap. And even if it did, the committee may decide that there’s been enough destruction to justify booting it in exchange for a better-performing alternative.
You might even view owning an index like the S&P 500 and Dow Jones as long-term momentum investing. You naturally get exposure to companies that have risen to the upper echelon of the economy and stock market.
This isn’t to say that the Index stewards always get their additions and subtractions right. Sometimes the stocks they ditch do quite well afterward. Likewise, sometimes the stocks they add do poorly. But these have been the exception to the rule, and on balance, owning broad market indexes has been an excellent way of getting equity exposure.
Legal Disclaimer
Trading Justice LLC (“Trading Justice”) is providing this website and any related materials, including newsletters, blog posts, videos, social media postings and any other communications (collectively, the “Materials”) on an “as-is” basis. This means that although Trading Justice strives to make the information accurate, thorough and current, neither Trading Justice nor the author(s) of the Materials or the moderators guarantee or warrant the Materials or accept liability for any damage, loss or expense arising from the use of the Materials, whether based in tort, contract, or otherwise. Tackle Trading is providing the Materials for educational purposes only. We are not providing legal, accounting, or financial advisory services, and this is not a solicitation or recommendation to buy or sell any stocks, options, or other financial instruments or investments. Examples that address specific assets, stocks, options or other financial instrument transactions are for illustrative purposes only and are not intended to represent specific trades or transactions that we have conducted. In fact, for the purpose of illustration, we may use examples that are different from or contrary to transactions we have conducted or positions we hold. Furthermore, this website and any information or training herein are not intended as a solicitation for any future relationship, business or otherwise, between the users and the moderators. No express or implied warranties are being made with respect to these services and products. By using the Materials, each user agrees to indemnify and hold Trading Justice harmless from all losses, expenses, and costs, including reasonable attorneys’ fees, arising out of or resulting from user’s use of the Materials. In no event shall Tackle Trading or the author(s) or moderators be liable for any direct, special, consequential or incidental damages arising out of or related to the Materials. If this limitation on damages is not enforceable in some states, the total amount of Trading Justice’s liability to the user or others shall not exceed the amount paid by the user for such Materials.
All investing and trading in the securities market involve a high degree of risk. Any decisions to place trades in the financial markets, including trading in stocks, options or other financial instruments, is a personal decision that should only be made after conducting thorough independent research, including a personal risk and financial assessment, and prior consultation with the user’s investment, legal, tax, and accounting advisers, to determine whether such trading or investment is appropriate for that user.
