


This month’s newsletter takes your chart reading skills to the next level. Once you’ve grasped the basics of reading a stock chart and spotting trends and patterns, you can enhance your probability of profit by harnessing the power of multiple time frames.
The process involves consulting various time frames to ensure your trade has the best chance of success. Traders who embrace this approach to the fullest only place trades when each time frame is in alignment. Avoiding trades with conflicting signals should improve your win rate and ultimately generate more profits.
Let’s break down a few definitions to get us on the same page.
What is a Time Frame?

The chart time frame is identified by what each candlestick represents. For instance, each candle represents one hour on the hourly time frame. And, on a weekly chart, each candle reflects one week. Here are the common time frames you’ll see:
5-minute Chart: 1 Candle = 5-minutes
Hourly Chart: 1 Candle = 1 hour
Daily Chart: 1 Candle = 1 day
Weekly Chart: 1 Candle = 1 week
Monthly: 1 Candle = 1 month
Multiple smaller candles are compressed into fewer larger ones as you move up the scale. Moving from a lower time frame to a higher one presents a clearer picture. It tunes out the noise, in other words, and provides a bird’s eye view. Trends and support/resistance zones that may have been off the radar because you were looking too closely will come into view with this approach.
Moving from higher time frames to lower ones provides more detail. It’s as if you’re looking into a magnifying glass to zoom in and see more information. It allows for more precision and pinpointing entries and exits.
Moving up and down the time frame scale helps you see both the forest and the individual trees.
To better grasp how the compression of multiple smaller candles into a single large candle works, consider the following:
One daily candle = 6.5 hourly candles or 13 30-min candles
One weekly candle = 5 daily candles, 32.5 hourly candles, or 65 30-minute candles
One monthly candle = 4 weekly candles, 20 daily candles, 130 hours, or 260 30-minute candles
Given the many choices between time frames, it can quickly get overwhelming if you don’t have a process. Before placing a trade, you don’t need to sift through half of a dozen time frames. The most popular and arguably most effective approach for using multiple time frames involves using only three.
3-Time Frame Structure
For a proper three-time structure, you need a main time frame, a smaller time frame, and a larger time frame. Here are three that might be used by a Day, Swing, and Position trader:
Day Trader: Smaller: 1-minute, Main: 5-minute, Larger: Hourly
Swing Trader: Smaller: 5-minute, Main: Daily, Larger: Weekly
Position Trader: Smaller: Daily, Main: Weekly, Larger: Monthly
And here are the best practices and purpose behind each view.
Main: This is the time frame you spend most of the time finding and analyzing your trade. The trend and patterns found here will form the basis of your trade. You will also usually identify the stop, entry, and target based on this time frame.
Larger: This is the time frame you’ll use to confirm your bias on the main time frame. Identify the bigger trend and significant support and resistance zones that might not have been obvious in the main time frame. Ideally, we want to be trading in the direction of the larger time frame. Key principle: the trend and price thresholds here carry more weight than the main time frame. If there is a conflict between the two, those on the larger time frame trump. For instance, if the daily trend is up but the weekly trend is down, you should be cautious with bullish trades.
Smaller: Use this to fine-tune your entries or exits. Because of the greater detail, you can often identify quicker signals that could create more timely entries and exits. The smaller time frame is beneficial when the main time frame boasts larger candle sizes that don’t lend themselves to close signals.
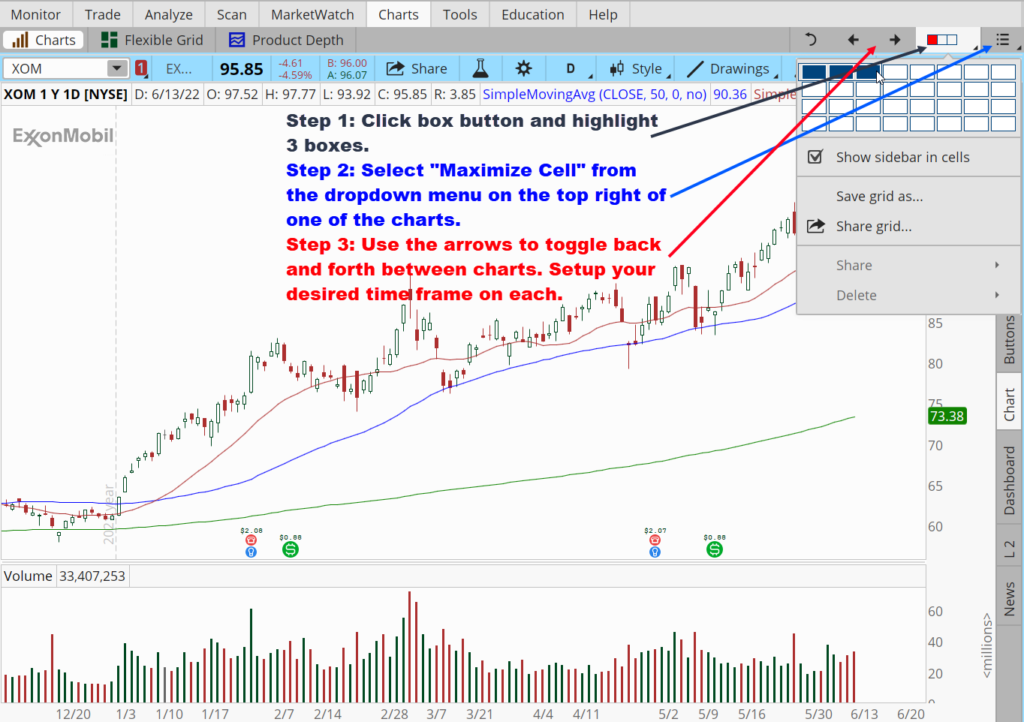
A popular approach for swing traders is to use a 1-year daily chart as the main, a 5-year weekly chart as the larger, and a 5-day 5-minute chart as the smaller. If you’re using ThinkorSwim, it’s possible to layout all three time frames so you can quickly toggle between them for speedier analysis.
Now that you have the basic definitions and approach under your belt let’s look at some examples to put them into practice. We’ll assume we are swing traders using the 5-minute, daily, and weekly charts.
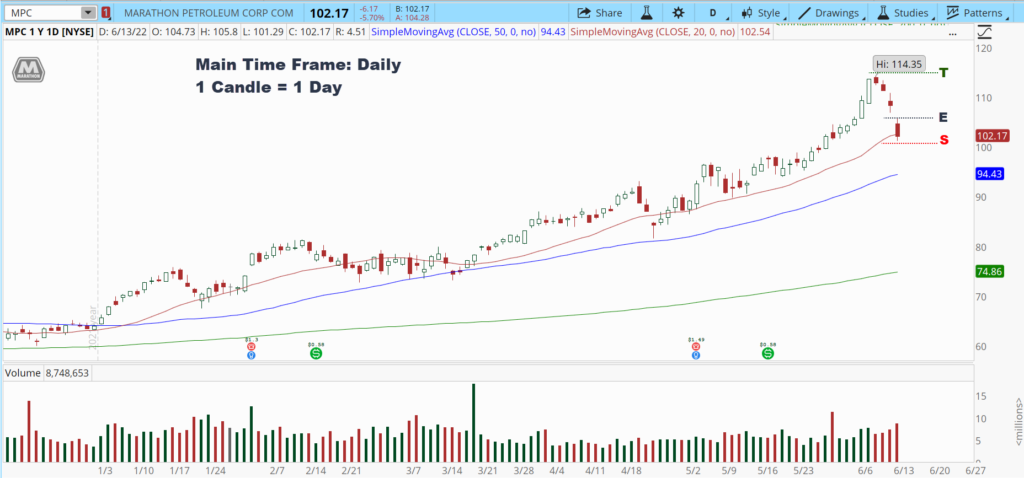
Bull Retracement: Marathon Petroleum Corp (MPC)
Oil prices and the desire for stocks that benefit from inflation are boosting shares of Marathon Petroleum Corp (MPC). The Ohio-based downstream energy company saw its shares balloon as much as 79% this year, even as the S&P 500 has entered a bear market.
Currently, the daily chart is sporting a classic bull retracement pattern. After making a higher pivot high on increasing momentum, MPC has retreated four consecutive sessions to its rising 20-day moving average to form a classic bull retracement pattern. A potential trigger (i.e., entry) for the setup is today’s high ($105.80), and a stop loss is today’s low near $101. The target is the prior pivot high of $114.35.
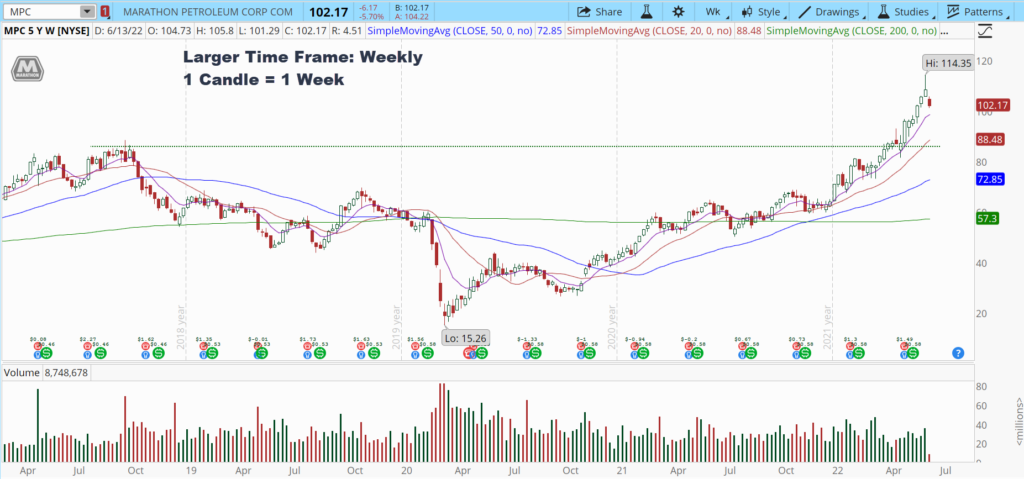
Now, let’s look to the larger time frame to see if the bigger picture supports our bullish read.
The weekly trend is highly bullish. After breaking through old resistance in the mid-$80s, prices blasted to $114.35 before finally finding resistance. The current daily retracement is creating the first red candle on the weekly. While we could pull back further because of slightly overbought conditions on the weekly, there isn’t anything that gives me pause for trading the bull retracement.
Now, at this point, we could place the trade if we were satisfied with the stop loss and entry prices we previously established on the daily chart. However, if we wanted a quicker entry or tighter stop loss, it may become necessary to zoom into the smaller time frame and see if there are logical alternate price levels to use.
Specifically, I’d be looking for a lower intraday resistance level that, if broken, could justify entering a bullish trade before we break above the day’s high.
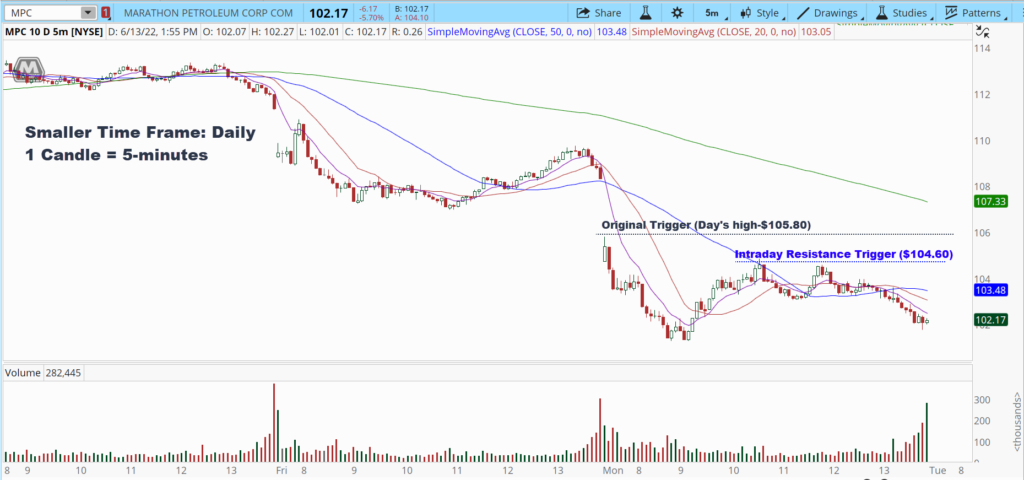
Here’s the 5-minute chart. I have mine set to 10-days but zoomed in so we could clearly see the last three trading sessions. Since the daily chart has fallen for four straight sessions, the 5-minute chart is in a downtrend. We scored an intraday bounce today that ultimately failed, with prices falling back to the lows. But we did form an intraday resistance zone at $104.60 in the process, giving us a potential ceiling for a quicker entry.
If I felt like waiting until we breached today’s high ($105.80) caused me to miss too much of the bounce, then I could use a trigger of $104.60 instead. You’ll find that the smaller time frame is most useful on days when we had an extensive trading range that created a wide-bodied bar on the daily chart. The smaller time frame would essentially be unnecessary if we had a doji or narrow-bodied candle on the daily chart.
Let’s summarize how we used each view with MPC.
Main: We used the daily to spot a quality bull retracement pattern and identify logical stop, entry, and target levels.
Larger: We used the weekly chart to confirm the overall bullish trend and ensure there weren’t any key support/resistance zones hidden from us on the daily. In this case, the weekly chart gave the green light to bullish trades.
Smaller: We used the 5-minute chart to spot a quicker entry point giving us an alternative to today’s high as a trigger.
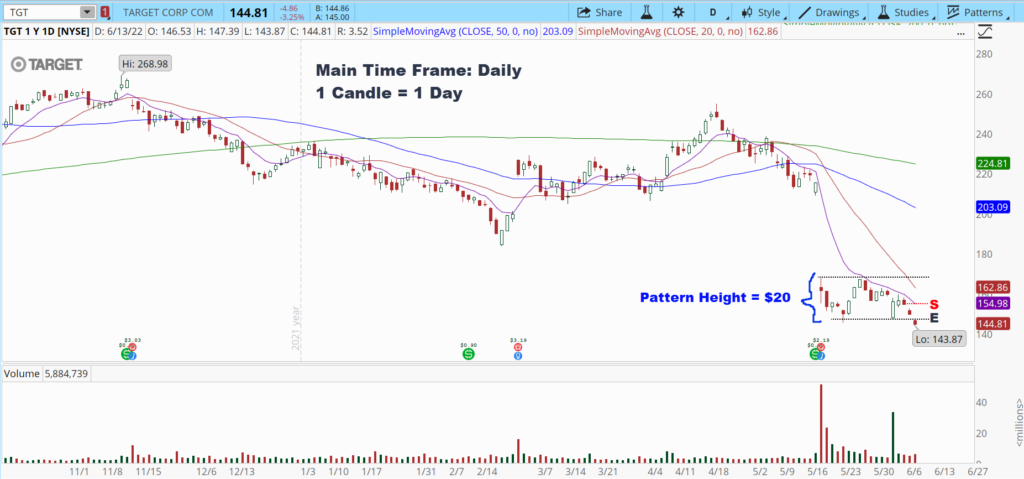
Bear Breakout: Target (TGT)
Retail stocks have been stumbling under the onslaught of inflationary pressures and recession fears. After suffering its most significant selloff since 1987, Target (TGT) shares have been building a trading range and just closed below the lower end to trigger a textbook bear breakout pattern. Today’s break of support near $147.50 was the trigger, and the falling 9 EMA, which is also yesterday’s high, is a potential stop loss. The target is challenging based on the daily chart because this is the lowest we’ve been. By default, I would subtract the range height ($20) from the support level to project a realistic target ($147 – $20 = $127. The weekly chart will come in handy in analyzing where the next key support zone could lie.
A potential trigger (i.e., entry) for the pattern is today’s high ($105.80), and a stop loss is today’s low near $101. The target is the prior pivot high of $114.35.
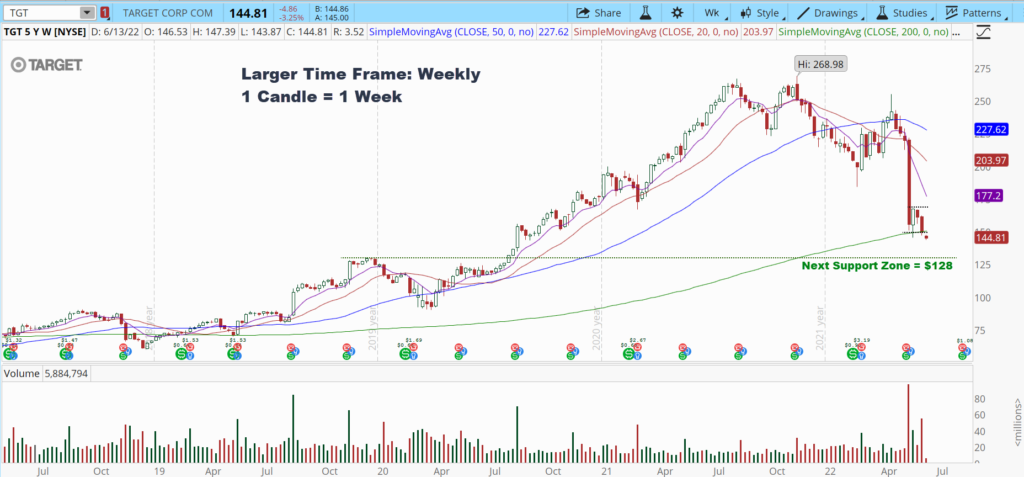
Let’s look to the larger time frame to see if the bigger picture supports our bearish bias.
The weekly trend is falling. After basing for three weeks, we’re seeing prices breach support as well as the 200-week moving average. That places TGT below all major moving averages. What’s more, there aren’t any previous support pivots until around $128, which gives us a reasonable $17 to $20 window from the breakdown point. This supports the forecasted $20 target from the daily chart based on the height of the trading range. While TGT is arguably oversold on the weekly time frame, the fact that it couldn’t rally more than a single candle after the earnings gap suggests buying appetite isn’t present at these levels.
For this particular pattern (Bear Breakout), the smaller time frame is almost irrelevant at this point. We’ve already established the stock has triggered based on the break below daily support, so the 5-minute chart won’t paint a different picture nor point us toward a better entry. The floor on the daily will also be the floor on smaller time frames. At the same time, the stop loss of the previous day’s high is close enough to make it appropriate. Going any closer based on intraday resistance zones wouldn’t be prudent.
Thus, I would skip the smaller time frame step for this situation. I generally find zooming in more useful when trading bull and bear retracement patterns over breakout plays.
To summarize the TGT trade:
Main: We used the daily to spot a clean bear retracement pattern and identify logical stop, entry, and potential target levels.
Larger: We used the weekly chart to confirm the overall bearish trend and ensure there weren’t any key support zones that would mess with downside follow-through from the daily support break. This confirmed that the $20 or so target was realistic given the overall trend structure.
With time and practice, switching time frames and incorporating the big picture and minute details into your analysis and trading will become second nature. You’ll gradually cut out mediocre trades that lack confirmation and confluence across time frames and begin focusing on the best patterns with the highest profit probability.
Now, get to work.
Legal Disclaimer
Trading Justice LLC (“Trading Justice”) is providing this website and any related materials, including newsletters, blog posts, videos, social media postings and any other communications (collectively, the “Materials”) on an “as-is” basis. This means that although Trading Justice strives to make the information accurate, thorough and current, neither Trading Justice nor the author(s) of the Materials or the moderators guarantee or warrant the Materials or accept liability for any damage, loss or expense arising from the use of the Materials, whether based in tort, contract, or otherwise. Tackle Trading is providing the Materials for educational purposes only. We are not providing legal, accounting, or financial advisory services, and this is not a solicitation or recommendation to buy or sell any stocks, options, or other financial instruments or investments. Examples that address specific assets, stocks, options or other financial instrument transactions are for illustrative purposes only and are not intended to represent specific trades or transactions that we have conducted. In fact, for the purpose of illustration, we may use examples that are different from or contrary to transactions we have conducted or positions we hold. Furthermore, this website and any information or training herein are not intended as a solicitation for any future relationship, business or otherwise, between the users and the moderators. No express or implied warranties are being made with respect to these services and products. By using the Materials, each user agrees to indemnify and hold Trading Justice harmless from all losses, expenses, and costs, including reasonable attorneys’ fees, arising out of or resulting from user’s use of the Materials. In no event shall Tackle Trading or the author(s) or moderators be liable for any direct, special, consequential or incidental damages arising out of or related to the Materials. If this limitation on damages is not enforceable in some states, the total amount of Trading Justice’s liability to the user or others shall not exceed the amount paid by the user for such Materials.
All investing and trading in the securities market involve a high degree of risk. Any decisions to place trades in the financial markets, including trading in stocks, options or other financial instruments, is a personal decision that should only be made after conducting thorough independent research, including a personal risk and financial assessment, and prior consultation with the user’s investment, legal, tax, and accounting advisers, to determine whether such trading or investment is appropriate for that user.