Four years ago, Tackle Trading launched the Cash Flow Condors trading system. It arrived amid much fanfare and unlocked all sorts of goodies for traders desiring to elevate their understanding of using iron condors for gaming market volatility and time decay. As the system architect who spent years learning and perfecting the approach, it was an exciting reveal for me. Since then, I’ve held monthly meetings for all system owners to discuss its implementation and management. We’ve traded through bull markets, bear markets, and everything in between. By my count, I’ve now led 48 of these mastermind sessions, helping to keep the team on track through thick and thin.
I’d contend that the individual that’s benefited most over the years has been me. Accountability matters in the field of investing. Knowing I had to discuss the system’s performance each month motivated me to do two things. First, I had to follow the guidelines outlined in the system’s video series. That is, I stayed true to the rules that made selling condors so successful in the past – even when it wasn’t easy. Second, I explored every tip and trick I knew of to help team members navigate adverse conditions. As any long-time trader will tell you, it’s not the winners that define your success. It’s the losers.
And, due to the incredible volatility we’ve experienced over the past five years, there have been many losers. I have two objectives for this month’s newsletter.
First, I want to explore what happened and the lessons we should all learn from it to become better traders.
Second, I want to discuss how these lessons can shape the Cash Flow Condors system moving forward.
Let’s get started.
The System

For the uninitiated, the iron condor is an options trade that profits if the market remains neutral or rangebound. It consists of simultaneously selling an out-of-the-money bull put and bear call spread. You receive a credit at trade entry that represents the max profit if the stock ends up remaining between both spreads. Essentially, we are selling puts and calls that we hope will expire worthless.
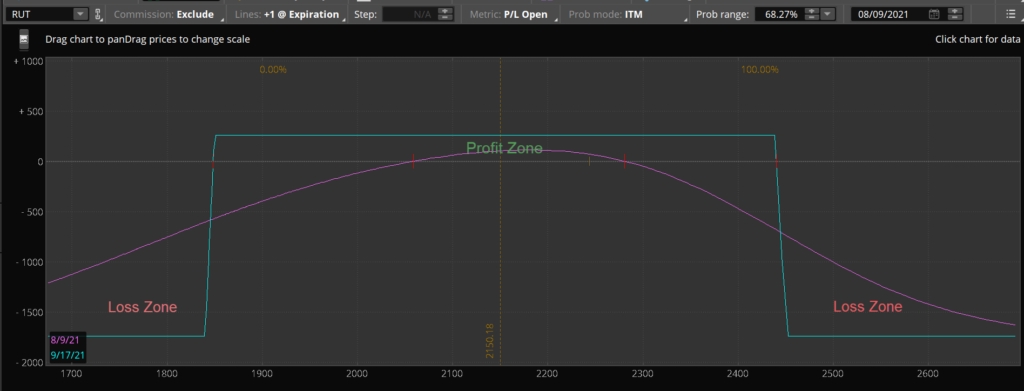
Here is a risk graph of an iron condor. Note how you profit if the stock remains in the middle of the graph. If prices move too high (right) or too low (left), you will incur a loss.
The idea behind the Cash Flow Condors system was to build a set of rules around the iron condor strategy that we could apply every month to an index such as the S&P 500 or Russell 2000.
Here are the base rules of the system:
- 1) Enter around 60 days to expiration on the Russell 2000 Index (RUT)
- 2) Sell a $10-wide bull put spread and a $10-wide bear call spread for around 60 cents apiece, or $1.20 total net credit.
- 3) Short option deltas should be < 0.10.
- 4) Probability of profit should be > 80%.
- 5) Profit target is to ride to expiration or close either spread at 10 cents.
- 6) Stop Loss is to exit the losing side if prices reach the short strike price.
There are additional guidelines for hedging or adjusting the trade in adverse conditions, but these give you a general idea of the system.
To illustrate how the risk graph translates to a price chart, here’s a screenshot of what the October 2021 trade might look like using the current RUT price of $2,243.
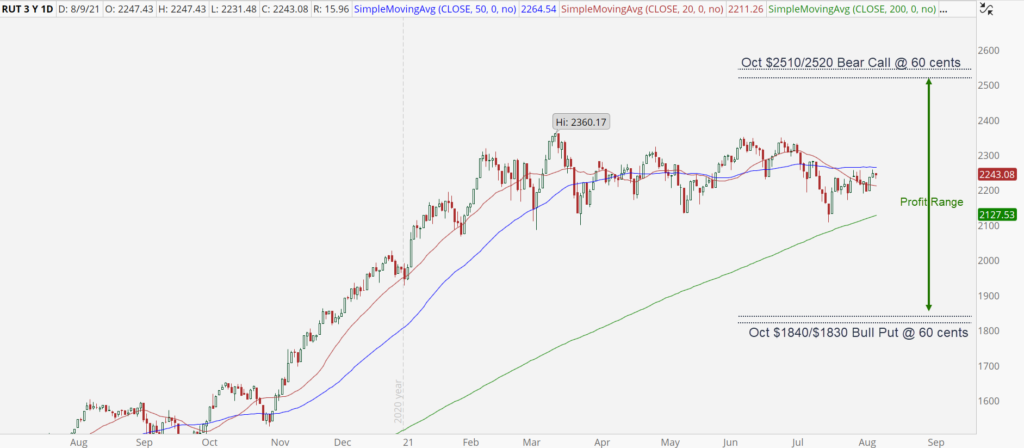
If RUT remains between $1840 and $2510 for the next two months, we will score a profit of $1.20 per share or a 13.6% return on investment.
The edge of the system ultimately comes down to options being overpriced. If the market consistently moves less than expected, then iron condor should be a profit generator in the long run. In trader parlance, we would say iron condors thrive when realized volatility is less than implied volatility. The opposite is also true. Iron condors lose when prices move more than expected (that is, when realized volatility exceeds implied volatility).
Now that you understand the structure and edge behind the system, let’s look at how it’s fared since the mid-2017 launch.
Post-Launch Performance

Let’s start with what the expectations should have been based on the implied probabilities of the system. Per the base rules above, the probability of profit should be 80% since we’re selling deltas of 10 or less. However, in reality, we’re usually selling deltas around 7 or 8, which bumps the probability closer to 85%. Thus, we would expect to win approximately eight out of ten times.
I’d emphasize that these numbers play out in the long run, not the short run. This stresses the need for a large sample size to draw meaningful conclusions. Per the intro, we’re closing in on 50 trades since launch. While I’d like to have hundreds of occurrences to bolster our confidence in the numbers, I think you’ll agree that 50 is certainly large enough to generate at least some conclusions. It also played out over four years, providing a fair bit of variety in market conditions to consider this an appropriate test.
If we hit the 85% win rate on the nose, we would have won 41 out of the 48 trades. Said another way, we would have lost seven trades.
Now, look at the price chart of RUT over the past four years and decide how you think iron condors fared. I labeled the largest moves we’ve seen along the way.
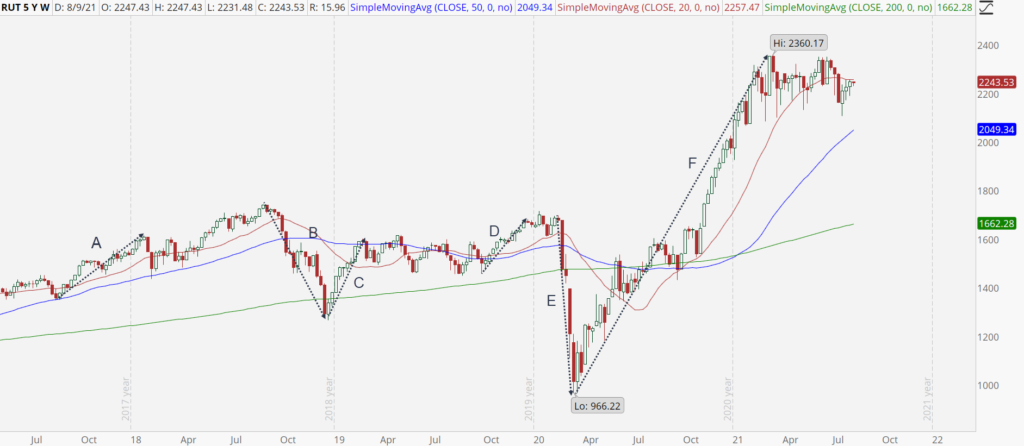
The scale can be a little misleading because of how dramatic the March 2020 crash was compared to the post-November recovery. It makes other moves look less aggressive, even though they were pretty significant. To help put the wildness of the swings in context, here are the largest peak-to-trough moves over the past five years.

Unsurprisingly, every episode created losses for those using the basic Cash Flow Condors system. Pulling each losing trade back from the jaws of defeat would have required hedging or adjustment tactics. We discussed many of them in our monthly mastermind meetings.
The most irritating backdrop for condors came with the global pandemic. First, we suffered the fastest drawdown in history for the RUT (-43% in one month). Then we saw prices score one of the most rapid recoveries ever. We regained all that was lost – plus another 44%.
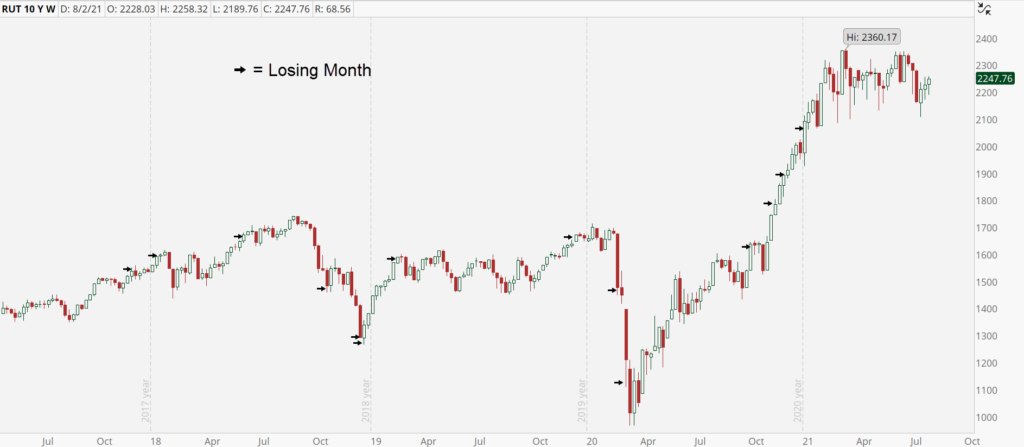
Far from losing 7 of the 48 trades, the employer of the condors system likely had 14 losers along the way. That translates into a win rate of only 70%. I won’t mince words. That’s a terrible win rate for systematically selling single-digit delta options. And it speaks to just how extraordinary the market volatility has been in recent years. Indeed, this might have been the most challenging environment of the past 25 years for condor traders.
Here’s a second look at the RUT chart with the losing trades notified by arrows.
Three Crucial Questions
The poor results should cause the inquisitive trader to ask a few questions.
- First, are iron condors destined to be dead money in the future?
- Second, is there anything that we could have done to improve the performance?
- Or, on a related note, what lessons can we learn from the pitiful plight of the once-mighty condor strategy?
Dead Money?
The million-dollar question is whether iron condors on indexes are permanently impaired. Has the market shifted sufficiently to blunt the once sharp edge of the Cash Flow Condors system? You’ll recall the edge lies with options being overpriced. Historically (at least before the last five years), the market moved less than expected enough times to make selling condors a money-winning strategy. Arguing that condors are dead money moving forward requires you to believe that options now trade consistently cheap.
Further, it demands you believe realized volatility will continue to exceed implied volatility. Personally, I find that hard to swallow because it goes against human nature. People are hard-wired to overpay for insurance. They exaggerate future uncertainty, and that manifests itself in pumped-up options premiums.
The only other logical conclusion is to view the multi-year period we just lived through as an aberration, a blip on the long run radar, unlikely to be repeated. The return for any system or asset class fluctuates over time; above-average returns are followed by below-average returns. What if we just witnessed an extended period of below-average returns, and a spurt of above-average returns for iron condors lies on the horizon?
Throwing in the towel now could ensure that you miss out on future gains.
Improving Condor Returns
The next query considers what was needed to improve the condor returns. While the unmanaged condor that lacked hedging or adjustments fared poorly, it doesn’t mean that all condor traders suffered the same.
If nothing else, the difficult five-year period just finished should etch in our minds the following mantra: adapt or die.
In the years leading up to the Cash Flow Condors launch (again, mid-2017), you really didn’t need to do much other than enter the trade, ignore it, and return to pick up your money at expiration. The occasional losing trade was more than offset by the deluge of winners.
But since then, generating profits has required a good deal of hedging and entering offsetting positions. For instance, I’ve focused on the market trend and adapting my overall portfolio to match. In the post-pandemic rebound, when RUT prices more than doubled, I found myself owning IWM shares (the RUT ETF). As a result, the losses incurred when my bear call spreads got hit were always more than offset by the gain in my IWM shares.
Other traders might have only entered one side of the condor to make it more directional when a strong trend was in place. Those who stuck with selling bull put spreads over the past year have fared extremely well.
Famed economist John Maynard Keynes famously quipped, “when the facts change, I change my mind – what do you do, sir?”
We could complain about the tricky environment, or bemoan the fate of condor traders, but what’s the point? It’s unproductive. Adverse conditions have persevered for longer than even I, the system architect, would have guessed. However, like all good traders before me, I’ve tried to change how I use condors to make them work better for my portfolio.
Here’s another lesson that parallels the importance of adapting – position sizing.
Position Sizing is Paramount

Absent smart hedging or adjustments, Cash Flow Condors delivered multiple losing streaks over the past five years. Trading through them without suffering irreparable damage to your portfolio required proper position sizing. I’m fond of the sizing rule that states you don’t place more than 10% of your portfolio in each month’s trade at most. That comes out to roughly one contract per $10,000 in your account. This ensures that a losing month only steals around 3% of your overall account. That way, if a three-month losing streak comes your way, you only suffer a 9% drawdown. Four losing months creates a 12% loss. So on and so forth.
It is extremely rare to see four losing months in a row, by the way.
One final takeaway that I hope system owners learned is the importance of having a team behind them. Adversity is best suffered with a community, not in a silo. Every single month, anyone who has Cash Flow Condors can join us to discuss what’s going on in the markets and how to best handle the strategy. We’ve identified loads of adjustments along the way to better adapt to the high volatility backdrop. But only those who participated, who made an effort to show up and go the extra mile after having watched the system videos, were able to take their trading to the next level.
If you weren’t one of them. Come join us!
Legal Disclaimer
Trading Justice LLC (“Trading Justice”) is providing this website and any related materials, including newsletters, blog posts, videos, social media postings and any other communications (collectively, the “Materials”) on an “as-is” basis. This means that although Trading Justice strives to make the information accurate, thorough and current, neither Trading Justice nor the author(s) of the Materials or the moderators guarantee or warrant the Materials or accept liability for any damage, loss or expense arising from the use of the Materials, whether based in tort, contract, or otherwise. Tackle Trading is providing the Materials for educational purposes only. We are not providing legal, accounting, or financial advisory services, and this is not a solicitation or recommendation to buy or sell any stocks, options, or other financial instruments or investments. Examples that address specific assets, stocks, options or other financial instrument transactions are for illustrative purposes only and are not intended to represent specific trades or transactions that we have conducted. In fact, for the purpose of illustration, we may use examples that are different from or contrary to transactions we have conducted or positions we hold. Furthermore, this website and any information or training herein are not intended as a solicitation for any future relationship, business or otherwise, between the users and the moderators. No express or implied warranties are being made with respect to these services and products. By using the Materials, each user agrees to indemnify and hold Trading Justice harmless from all losses, expenses, and costs, including reasonable attorneys’ fees, arising out of or resulting from user’s use of the Materials. In no event shall Tackle Trading or the author(s) or moderators be liable for any direct, special, consequential or incidental damages arising out of or related to the Materials. If this limitation on damages is not enforceable in some states, the total amount of Trading Justice’s liability to the user or others shall not exceed the amount paid by the user for such Materials.
All investing and trading in the securities market involve a high degree of risk. Any decisions to place trades in the financial markets, including trading in stocks, options or other financial instruments, is a personal decision that should only be made after conducting thorough independent research, including a personal risk and financial assessment, and prior consultation with the user’s investment, legal, tax, and accounting advisers, to determine whether such trading or investment is appropriate for that user.
