When I first started learning options trading, I followed the educational path all pupils should use. I started with the basics, mastered them, and then moved on to the more advanced items. As I reflect on my journey, I’m reminded of just how challenging I found the topic of implied volatility. Fortunately, I was patient, and an unparalleled tutor named experience eventually taught me all that I needed to know.
Today’s newsletter is a message to my earlier self. It contains a complete lesson on implied volatility. Within, I’ll share in the simplest terms possible what it is, why it matters, and how to properly use it. Of necessity, I’m making some assumptions about what you already. Quick styling note, to break up the monotony, I will sometimes refer to implied volatility as implied vol or IV.
On we go.
Options Pricing

One of the first newsletters I penned for Trading Justice was titled “Option Pricing.” It was published in May 2018 and introduced you to the Black Scholes Model, the formula used to determine an options price.
It answers the question, “what should this options contract be worth?”
These are the six inputs to the pricing model:
- Stock price
- Strike price
- Time to expiration
- Volatility
- Dividends
- Interest Rates
Five of the six variables are known. The sixth is unknown. It is an educated guess or estimate, usually based on past performance. Can you guess which one it is?
The answer is volatility.
Let’s pretend we’re trying to price a new call option that will begin trading tomorrow. Perhaps it is the first time options are being listed for a company that just went public. The stock price is $50. The strike price is $50 (this is an ATM option). There are 30 days to expiration. The stock doesn’t pay a dividend. And the risk-free interest rate (as reflected by a three-month treasury bill) is zero. All of these are known knowns.
The only unknown is how volatile the stock will be between now and the call option’s expiration. So, what do we do? We make an educated guess and input a volatility assumption. A good rule of thumb is to use the stock’s historical volatility (how much it’s moved in the past) and shift it up or down depending on pending news or market events. In this case, the person pricing the option would be hoping that the past is indeed prologue.
Let’s pretend the volatility assumption is 70%.
Based on these six inputs, the Black Scholes Model spits out a theoretical (or fair) value for the call option of $4.00. That would be the midpoint price. We’ll assume the option trades with a bid of $3.95 and an ask of $4.05.

One important point. The volatility input for the Black Sholes Model is not implied volatility. Instead, think of it as forecast volatility. In other words, if you’re the market maker trying to price this new option, you have to use your best judgment on what volatility number to use.
Now, let me show you where implied volatility comes in.
Whither Supply and Demand?
Once an option starts trading, supply and demand become dominant factors driving its price. This is intuitive, and it’s essentially how all freely traded goods work. All else equal, if demand outweighs supply, then the option’s price will rise and vice versa.
Imagine the $50-strike call option starts trading and opens with a midpoint value of $4.
Now, hold all the other inputs constant. Assume the stock price, strike price, time, dividends, and interest rates don’t change. But a big buyer comes in and purchases 1,000 contracts. Here’s how filling the order might work based on the available supply.
$4.00: 100 contracts fill, then prices rise.
$4.20: 100 contracts fill, then prices rise.
$4.40 200 contracts fill, then prices rise.
$4.60: 300 contracts fill, then prices rise.
$5.00: the final 300 contracts fill.
Here’s the key takeaway: The call option rose by 20% (from $4 to $5) for no other reason than demand increased.
If you’re familiar with call options, you know this is the formula to calculate breakeven, or where the stock needs to be for you to recoup the initial premium paid:
-Call Strike price + Premium = Expiration Breakeven
If you bought the $50-strike call for the initial $4, then you only needed the stock to rise to $54 by expiration to break even. And, remember, the $4 price tag corresponded with a volatility assumption of 70%.
But then, a giant whale came in and bid the call price up to $5. That pushes the expiration breakeven up to $55. The only way that $5 is a fair value for the same $50 at-the-money call option is if the stock is more volatile than previously assumed. The volatility assumption corresponding to a $5 call price isn’t 70%. It’s 87%.
Here’s a logic chain to think through what happened.
-Demand pushed the call option price higher.
-A higher call option price requires a bigger rise in the stock price to break even.
-The stock now has to be more volatile to justify the new prices that traders are paying for the call option.
-Thus, the more expensive call option implies the stock needs to be more volatile.
We find implied volatility by looking at the current price of an option. If the options price is high, implied volatility will necessarily be high. If the options price is low, implied volatility will necessarily be low.
I picture taking a magnifying glass to an options price tag. Embedded in the price is a number known as implied volatility.
What are you Solving For?
Here’s another way to think about getting to implied volatility. At first, we used the Black Scholes Model to find the option’s price. We did this, of course, because the contract didn’t exist yet. We were the market maker getting ready to list a previously unlisted option. Thus, we plugged the following inputs into our formula to solve for the options price.
- Stock price: $50
- Strike price: $50
- Time to expiration: 30 days
- Forecast Volatility: 70% (this is a guess)
- Dividends: none
- Interest Rates: zero

As outlined in the above graphic, the solution was $4.00.
But then, the option gets listed, and supply and demand take over. The big buy order of 1,000 contracts promptly boosted the call price to $5.00. This occurred, mind you, while all other inputs stood still.
To calculate implied volatility, you plug in the options price and work backward to find the volatility assumption. Previously, we used the model to solve for a fair call price. That was the ultimate unknown. Now, we know the call’s value – $5. We can use that to work
- Stock price: $50
- Strike price: $50
- Time to expiration: 30 days
- Dividends: none
- Interest Rates: zero
- $5.00 is the options price
Solve for Volatility
The options calculator I used earlier can perform this function as well. The blue section shows the original formula solving for the call price. The red section inputs the $5 call price and solves for volatility. This is the mathematical way we calculate implied volatility.

In case any key takeaways got lost in the shuffle, let me outline them here:
1. Implied volatility is embedded in an options price.
2. If you hold all inputs constant and an options price rises or falls, then it’s a function of supply and demand.
3. Rising demand pushes option premiums higher, which pushes implied volatility higher.
4. Thus, rising demand causes implied volatility to go up, and falling demand causes implied volatility to go down.
Knowing the level of demand for options helps you in two ways. First, it lets you identify if options are cheap or expensive. Second (and related to the first), it helps you know if it’s better to be a buyer or seller of options. We’ll discuss both of these below.
Tracking Vol
The simplest way to follow implied volatility is by adding it as an indicator to your charting platform. Then, when you pull up a new stock, it will automatically populate the IV metrics for that stock’s options. If you’re using ThinkorSwim, you’ll want to add the study called “Impvolatility.”
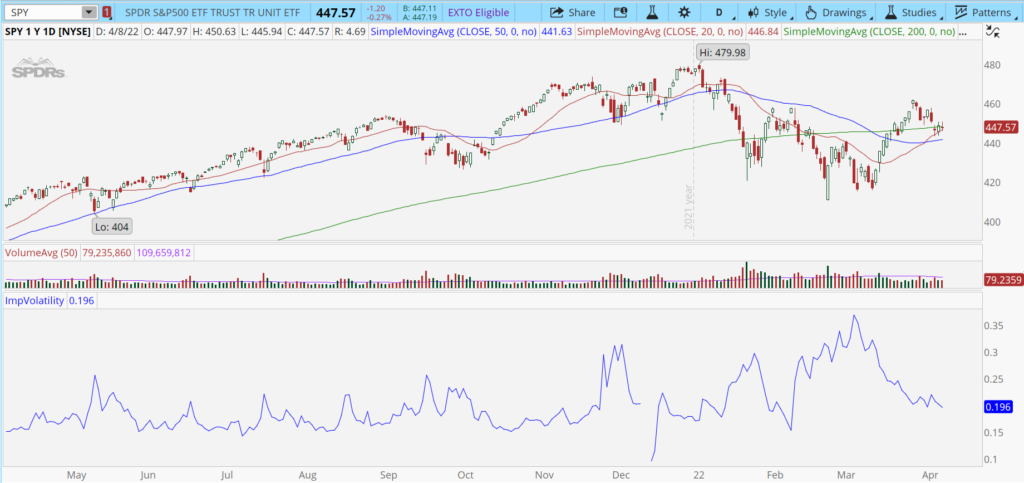
Here’s an example using SPY.

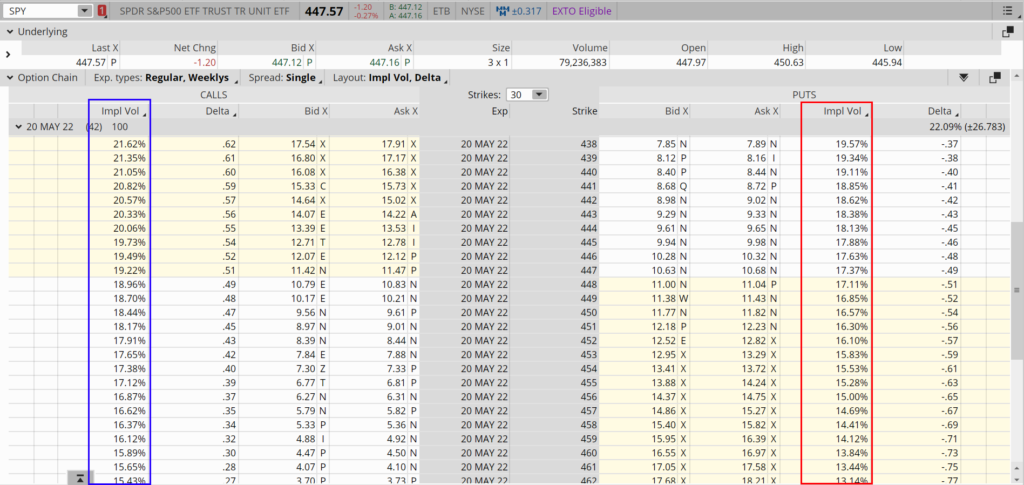
Every single option has its own implied volatility, so the indicator looks at the average implied vol of 30-day contracts. You could look at the options chain and add IV as a column heading if you wanted to. Then you could nail down the exact IV of the call or put that you’re trading. But usually, that’s overkill. The ImpVolatility indicator does an excellent job of illustrating whether options are generally cheap or expensive. Notice how the blue line fluctuates up and down over the past year. The high point was 0.35, and the low point was around 0.15. Though labeled as decimals, these are actually percentages. So, SPY options have traded with an IV between 35% and 15% over the past year. If we split the range in half (midpoint is 0.25 or 25%), anything above it shows options are above-average in price, and anything below it is below-average.
That said, options tend to trade below the midpoint most of the time. So to narrow down the number of signals of when prices are low, consider looking for stocks with an IV in the lower quartile of their one-year range. For SPY, that would be any reading below 20%.
Thus, with IV currently at 20%, SPY options are on the cheaper end of the scale. That means options selling strategies like naked puts or iron condors aren’t as attractive. And it means that options buying strategies like long calls or puts are more attractive. Of course, purchasing options would be even more tempting if the IV dropped to 15%.
As referenced earlier, here’s what a SPY options chain looks like with the implied volatility of different strikes displayed.

The implied volatility for each stock varies due to different personalities. For instance, Tesla trades with higher implied volatility than Walmart because it’s a higher beta stock with more movement. Stocks like Walmart might see their options IV fluctuate between 10% and 20%. By contrast, Tesla options IV could fluctuate between 30% and 80%. Thus, there isn’t a standard number for what’s high or low for each stock. For years, traders had to look at the IV range for each stock before determining if the current reading was high or low.
And then, Implied Volatility Rank (aka IV Rank or IVR) came along. It’s a new and improved way of tracking implied volatility that equalizes the range across different stocks so you can make apples-to-apples comparisons. Here’s how it works.
IV Rank Simplifies Signals
Explaining IV rank can get complicated, so I’m going to make it as digestible as possible. Basically, it modifies Impvolatility so that every stock has the same range. Here’s how it works.
First, make the upper end of the Impvolatility range for the past year “100.”
Second, make the lower end of the Impvolatiltiy range for the past year “0.”
Third, state the current IV reading as a percentage of that range. It reflects the rank or percentile between 0 and 100 that options are currently priced at.
If the reading is above 50, you’re in the upper half of the range, and options are officially expensive. If the reading is below 25, you’re in the lower half of the range, and options are officially cheap.
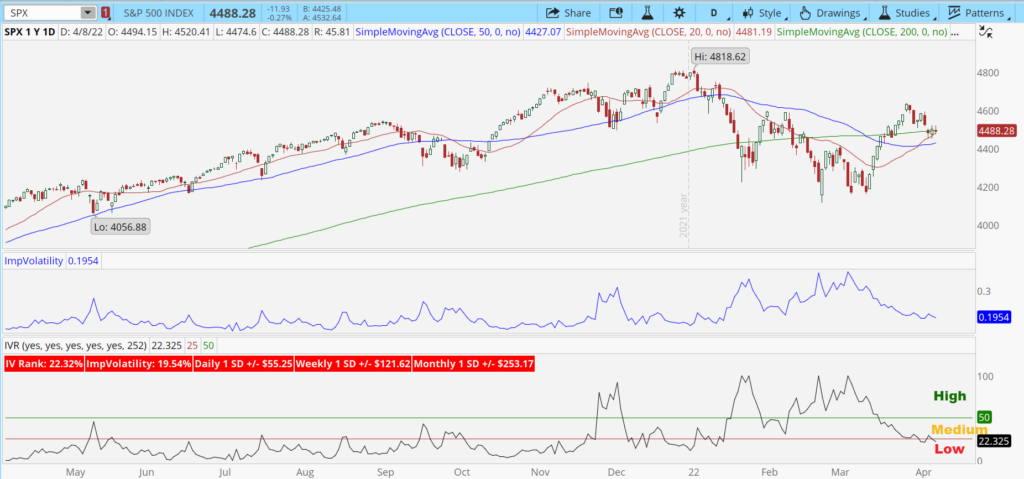
Take a fresh look at the SPY chart. This time I added IV Rank (green) below ImpVolatility (blue) so you can see the similarities and differences.

Notice how the fluctuations in both are identical. The only difference is the range. Again, the IV Rank adjusts the range from 15-35 to 0-100, allowing for more consistent comparisons between something as stable as Pepsi with something as crazy as Peloton.
The IV Rank is also color-coded. The boxes in the top left will be red if the IV is below the 25th percentile, yellow between the 25th and 50th percentiles, and green above the 50th percentile.
As suggested in the original discussion on Apple Impvolatility, at 19%, it’s officially in the lower quartile of its range and is thus colored red in the IVR. Each trader must decide how much emphasis to place on IV. Some might take the low IV as a signal to avoid selling AAPL options altogether since they’re so cheap. Others might be willing to accept a lower payday.
I did a more comprehensive write-up on using implied volatility with other factors for strategy selection in January 2021. The newsletter was titled The Definitive Guide to Options Strategy Selection.
Why IV Mean Reverts

To properly read and use IV requires understanding a few of its quirks. One of the most important is the tendency to mean revert. Mean reversion is just a fancy way of saying that IV oscillates in a range around some average level over time. Though the average may rise or fall during different regimes, it will never stop wanting to move to the mean.
The reason goes back to what drives implied volatility: supply and demand.
For implied volatility to trend higher indefinitely, demand for options would have to keep outpacing supply. But it doesn’t, for the simple fact that eventually, high prices entice sellers to step in and begin capitalizing on the sky-high premiums. Similarly, IV never trends lower to zero because eventually, prices become too low to justify selling.
When options prices are too low, supply dries up, demand increases, and prices rise.
When options prices are too high, demand dries up, supply increases, and prices fall.
Remember, IV is not a make-believe number. It reflects real-world forces and actual expectations for how much the stock will move. If the IV rises so much that it causes premiums to move to unrealistically high levels, no one would be willing to buy them anymore. And if they were that overpriced, sellers would enter the fray looking to collect on the fat premiums. Demand falls, supply rises, premiums drop, and so too does IV.
The opposite dynamic plays out when premiums get too cheap.
We’re nearly 2500 words in, and your attention span is likely waning. Let’s call it a day for this month’s volatility message. The VIX and volatility skew would have been next on my list, but we’ll save those for another time.
Legal Disclaimer
Trading Justice LLC (“Trading Justice”) is providing this website and any related materials, including newsletters, blog posts, videos, social media postings and any other communications (collectively, the “Materials”) on an “as-is” basis. This means that although Trading Justice strives to make the information accurate, thorough and current, neither Trading Justice nor the author(s) of the Materials or the moderators guarantee or warrant the Materials or accept liability for any damage, loss or expense arising from the use of the Materials, whether based in tort, contract, or otherwise. Tackle Trading is providing the Materials for educational purposes only. We are not providing legal, accounting, or financial advisory services, and this is not a solicitation or recommendation to buy or sell any stocks, options, or other financial instruments or investments. Examples that address specific assets, stocks, options or other financial instrument transactions are for illustrative purposes only and are not intended to represent specific trades or transactions that we have conducted. In fact, for the purpose of illustration, we may use examples that are different from or contrary to transactions we have conducted or positions we hold. Furthermore, this website and any information or training herein are not intended as a solicitation for any future relationship, business or otherwise, between the users and the moderators. No express or implied warranties are being made with respect to these services and products. By using the Materials, each user agrees to indemnify and hold Trading Justice harmless from all losses, expenses, and costs, including reasonable attorneys’ fees, arising out of or resulting from user’s use of the Materials. In no event shall Tackle Trading or the author(s) or moderators be liable for any direct, special, consequential or incidental damages arising out of or related to the Materials. If this limitation on damages is not enforceable in some states, the total amount of Trading Justice’s liability to the user or others shall not exceed the amount paid by the user for such Materials.
All investing and trading in the securities market involve a high degree of risk. Any decisions to place trades in the financial markets, including trading in stocks, options or other financial instruments, is a personal decision that should only be made after conducting thorough independent research, including a personal risk and financial assessment, and prior consultation with the user’s investment, legal, tax, and accounting advisers, to determine whether such trading or investment is appropriate for that user.
