This is the second of our two-part series on bear markets. In our February 2022 newsletter, we explored the what and why of bear markets. If you haven’t yet read it, do so. It sets the stage for this month’s message on how to survive them.
Let’s start with what I hope is obvious. There isn’t one correct answer for surviving a stock market decline. As with all things in investing, each path involves tradeoffs. My objective with this newsletter is to help you understand your choices so you can make an informed decision.
The worst possible thing any investor can do is panic sell in a bear market. It is the one sure way of guaranteeing subpar returns. Unfortunately, it’s an extremely tempting choice when the world is burning, and it seems like stocks will never recover. Bear markets can last for months – even years. Seeing your net worth decline by 30% or more can be horrific. The pressure to end the pain is real, and many succumb to it. But you mustn’t.
To that end, every idea below aims to prevent you from puking up your long-term positions in the heart of a downturn. How you manage short-term trades is a topic for another day.
On we go.

We begin with what is arguably the simplest and certainly the most conventional method for surviving bear markets: proper asset allocation. The term “asset allocation” refers to what percentage of your portfolio you place in various asset classes such as stocks and bonds. Indeed, these are the two core investments that comprise all conventional portfolios. Stocks offer higher returns but carry higher volatility. Bonds offer lower volatility but have lower returns.
The proper mix between the two is a function of your goals and risk tolerance.
The higher the growth rate needed to reach your goals, the more of your money should be invested in stocks. However, you must balance your desire for higher growth with your willingness to stomach volatility. The lower your tolerance for volatility, the more your portfolio should be allocated to bonds.
Bonds are terrible investments if you want to build long-term wealth.
Stocks are terrible investments if you want short-term stability.
All investors must decide how to strike the right balance between stability and growth. You have a great degree of control over your portfolio’s volatility and how much damage bear markets inflict. It all comes down to your asset allocation. Consider the following three portfolios, for instance:
Aggressive: 100% stocks
Moderate: 60% stocks/40% bonds
Conservative: 20% stocks/80% bonds
We can compare their performance over the past 15 years to understand the differences. I used the Vanguard Total Stock Market ETF (VTI) as the proxy for equities and the iShares Core US Aggregate Bond ETF (BND) to represent bonds. The data spans 2007 to 2022, which includes some of the best and worst years in history.
Study the following data and see if you can see the correlation between risk and return.

Here are three important takeaways:
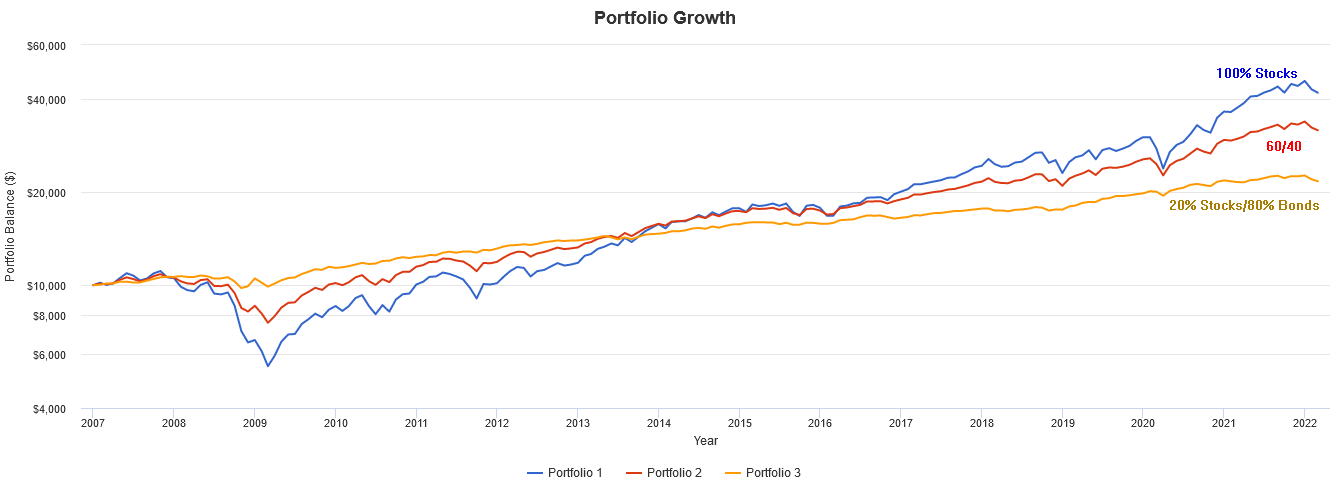
First, the all-stock portfolio delivered the highest overall return with a Compounded Annual Growth Rate (CAGR) of 9.93%. But it also required you to stomach the highest volatility with a standard deviation (Stdev) of 15.87%.
Second, the 20/80 portfolio had the lowest volatility with a standard deviation of only 4.4%. But it also grew the least.
Third, the maximum drawdown varied from -50.84% to -9.00%. All it took to reduce the severity was increasing the allocation to bonds.
Here’s the corresponding chart showing the performance of all three portfolios from start to finish.

So what’s the first way you can ensure you survive a bear market? Make sure you’re comfortable with the range of outcomes inherent to your portfolio allocation. If you can’t handle a 15% drawdown in your account balance once a year and a decline nearly twice that amount once every five years, then you can’t have all your money in stocks.
Or, try one of the remaining techniques.
Use Options to Reduce Risk
Some people characterize the options market as a place for gamblers and gunslingers. They’re only half right. Sure, you can use options for leveraged lottery-like bets. But you can also use these derivatives to reduce risk and protect your portfolio.
The two most common strategies used for this purpose are covered calls and protective puts. The latter enhances your probability of profit while providing a modicum of monthly protection. The former acts as an insurance policy offering ironclad protection no matter how dramatic the descent becomes.
Here’s a brief example of the covered call. Suppose you own 100 shares of the S&P 500 ETF (SPY) as part of your stock exposure. Indeed, to keep the case study simple, let’s say this represents the entirety of your equity portfolio. As of March 7th, 2022, SPY was trading near $420, giving you a portfolio value of $42,000. If the market fell 30% – the average bear market as we learned in last month’s newsletter – then SPY would shrink to $294, turning your $42,000 into $29,400.
Now, how might covered calls help?
The strategy involves selling monthly call options against your stock position. You get paid a premium in exchange for obligating yourself to sell shares at a particular price. If the stock trades sideways, down, or up a modest amount, you will keep the premium you got paid. If you’re capturing 1% in call premiums each month, you’re potentially offsetting up to 12% of the stock’s loss.
For instance, if SPY falls 30%, but you capture 12% in call premiums, it reduces the overall loss to 18%. Aside from the risk minimization, selling calls can also alleviate the pressure of feeling like you have to “do something” when the market is melting down. Think of it as a psychological trick to scratch the itch to act while still staying in the game. If it prevents you from abandoning your investments at the worst possible time, it’s a win.
That’s the basic idea behind the covered call. Last year we dedicated an entire newsletter to the strategy. You can read it here.
If you find the minor monthly risk offset from selling covered calls insufficient, consider buying protective puts.
A put option gives you the right to sell your shares at a set price, thus limiting the downside. It is like an insurance policy, complete with a premium and deductible. The premium cost varies depending on how much time you buy and how high the deductible is.
A good rule of thumb is to buy a one-year, 10% OTM put option. With SPY at $420, that would mean buying a March 2023 $375 put option. Think of the distance out-of-the-money as the deductible. The further out-of-the-money you go, the higher the deductible, and thus, the lower the premium. At the time of this writing, the cost is $26, which is high by historical standard. The expensive price tag is a byproduct of the extreme level of fear in the marketplace. There’s a ton of demand for insurance, and it’s driving premiums through the roof. In nonvolatile times, a similar one-year, 10% OTM put option might only cost $13.
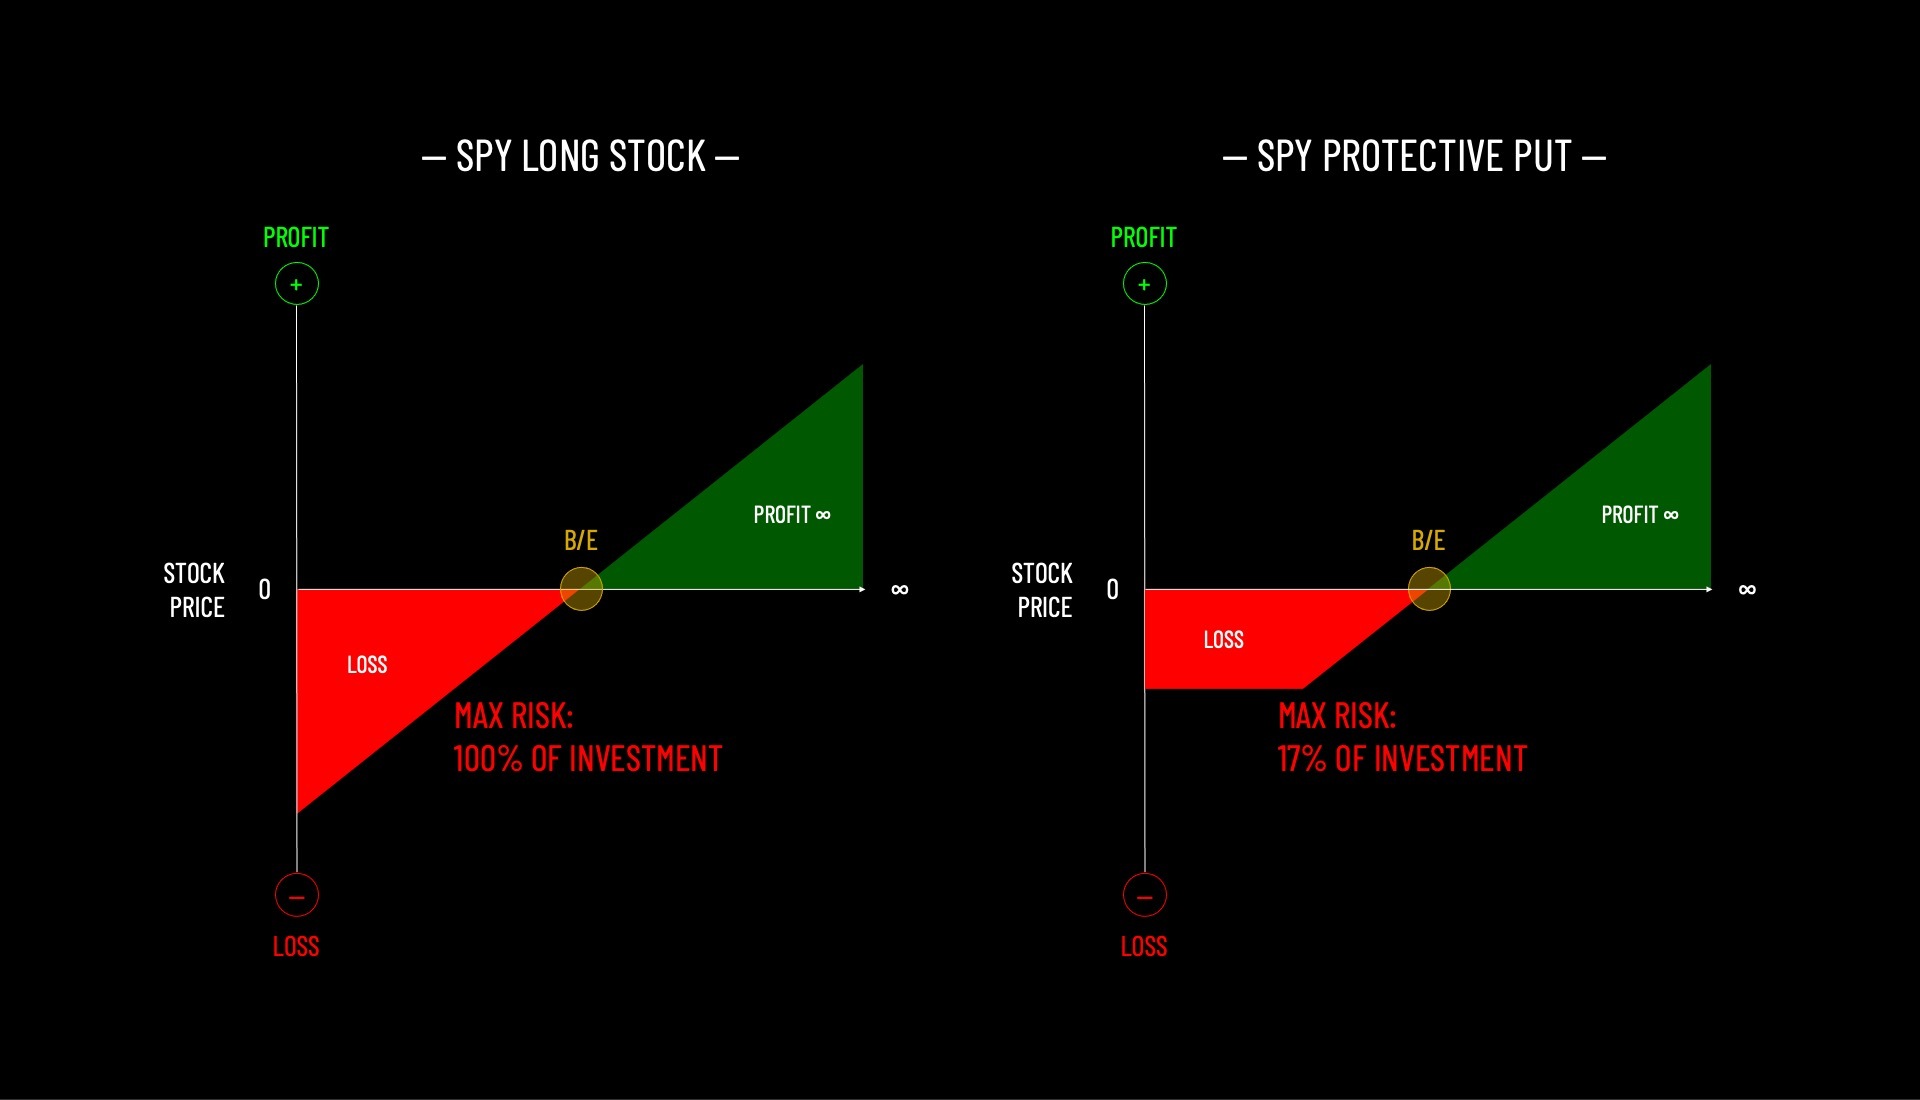
If you buy the put, you have the right to sell SPY at $375 for the following year. That limits your potential risk to $45 ($420 – $375) plus the insurance cost of $26 for a total of $71. That translates into a maximum loss of 17%.
Whether stocks fall 20%, 30%, or worse doesn’t matter. The put provides complete protection.
Here’s a visual showing the risk graph of your long stock position versus a protective put. Note the difference in the downside exposure.

If you’re wondering what the drawback is to buying puts for protection, it’s the same as with any insurance policy – the cost. The stock market rises three out of every four years. True bear markets only come once to twice a decade. The puts you purchase will likely be money losers outside of those rare episodes. You must decide if it’s worth the peace of mind.
If you find the idea of buying puts intriguing and want to learn more, check out this newsletter.
Or, better yet, take a look at the Bear Market Survival Guide at Tackle Trading, which provides an in-depth overview of how to deploy and manage protective put options.
Get Tactical
The third option involves market timing. In an ideal world, you would own stocks while they’re rising but be out when they’re falling. Unfortunately, it’s easier said than done. And not every pullback morphs into a nasty bear market, so there’s a chance you’ll get whipped out of your positions only to see the market recover.
Still, some traders are willing to risk the occasional whipsaw in exchange for dodging the deepest of declines. The trick is to find a goldilocks rule that doesn’t get you shaken out too frequently but is also timely enough so that you don’t lose too much before finally jumping ship.
Given what we learned in last month’s newsletter regarding the frequency of market selloffs, I think we can agree on what would be too close and too far away.
For instance, if you exit every time the S&P 500 falls 5% from its high, you’ll get bounced out nearly once a quarter. Every minor bump along the way will drive you away. Thus, setting your tripwire at -5% is too close.
On the other end, anything lower than -20% is too far away and runs the risk that you bail near the bottom after the bulk of the damage has already been done.
In summary, if you’re using the depth of the selloff to determine when to flee equities, something between -5% and -20% makes the most sense.
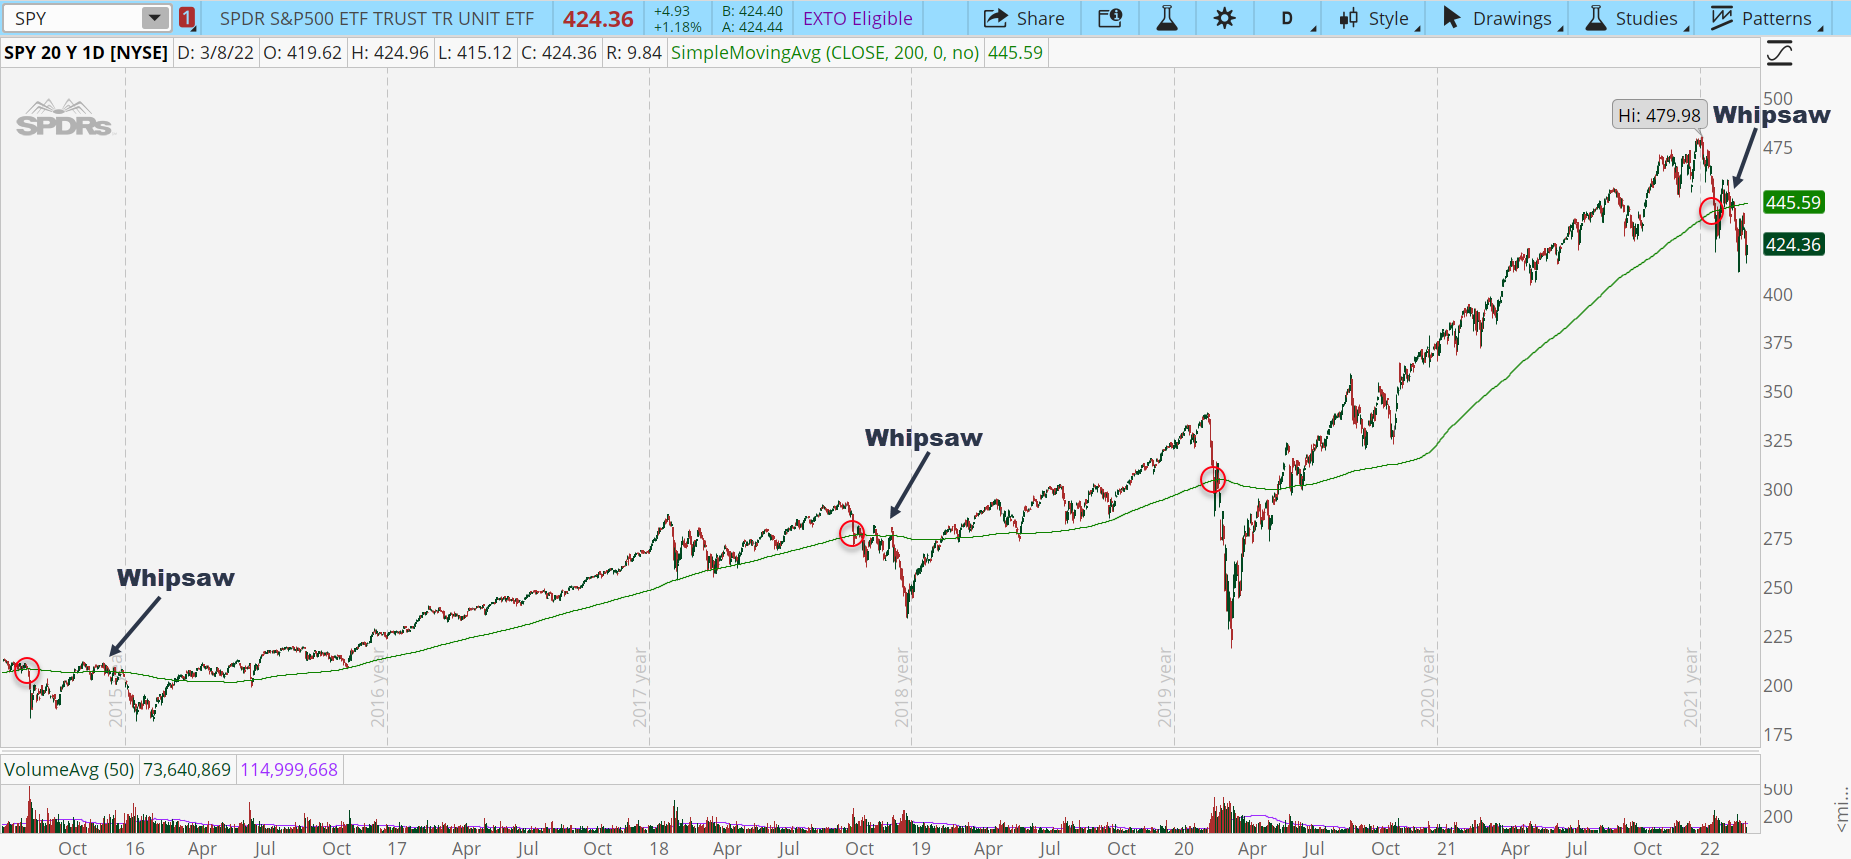
Another common method would be to use a charting signal to get you out, such as breaking major weekly support or a long-term moving average such as the 200-day. I find the moving average route quite appealing, if for no other reason than its simplicity. Here’s the last six years of the S&P 500 and the 200-day. I’ve highlighted some of the major sell signals with a red circle. Not every one resulted in a massive meltdown. Sometimes the market rebounded quickly. Other times we chopped back and forth through the 200-day, generating multiple false signals. These whipsaw periods are the most challenging part of using moving averages breaks as the signal. They can be noisy and test your conviction with multiple bad triggers before a good one emerges. And, unfortunately, you don’t know if it was a good signal until after the fact.

Keep in mind you don’t have to be all-in or all-out. You can incrementally ratchet your exposure higher or lower when market conditions shift. It’s easier on the emotions and avoids having a lousy signal cause you to miss out on a market rebound completely.
Admittedly, I’ve oversimplified the idea of tactically timing the market. The most compelling case I’ve seen against selling long-term investments when the market slips was made by Howard Marks of OakTree Capital in his recent memo titled “Selling Out.”
“…what about the idea of selling because you think a temporary dip lies ahead that will affect one of your holdings or the whole market? There are real problems with this approach:
Why sell something you think has a positive long-term future to prepare for a dip you expect to be temporary?
Doing so introduces one more way to be wrong (of which there are so many) since the decline might not occur.
Charlie Munger, vice chairman of Berkshire Hathaway, points out that selling for market-timing purposes actually gives an investor two ways to be wrong: the decline may or may not occur, and if it does, you’ll have to figure out when the time is right to go back in.
Or maybe it’s three ways, because once you sell, you also have to decide what to do with the proceeds while you wait until the dip occurs and the time comes to get back in.
People who avoid declines by selling too often may revel in their brilliance and fail to reinstate their positions at the resulting lows. Thus, even sellers who were right can fail to accomplish anything of lasting value.
Lastly, what if you’re wrong and there is no dip? In that case, you’ll miss out on the ensuing gains and either never get back in or do so at higher prices.
So it’s generally not a good idea to sell for purposes of market timing. There are very few occasions to do so profitably and very few people who possess the skill needed to take advantage of these opportunities.”
Mind Your Time Frame

Let’s expand on the first point made by Howard above. Namely, “Why sell something you think has a positive long-term future to prepare for a dip you expect to be temporary?”
Historically, an adequately diversified equity portfolio has recovered from every single decline. That’s what stocks do, and it’s a testament to the self-healing nature of capitalism. Time turns temporary losses into permanent gains. Here are the historical odds of the S&P 500 delivering positive returns over various rolling periods (Source: Nick Murray, Simple Wealth Inevitable Wealth).
1-year—75.72%
3-year—84.24%
5-year—88.29%
10-year—94.48%
15-year—99.69%
20-year—100%
Note how the odds of the market rising increase with time. How do you use this to your advantage? And how does this tie in to surviving a bear market?
Simple.
Only invest money you don’t need for at least five to ten years. Why would you willingly abandon your equity portfolio during a panic-induced plunge when there’s a nearly 95% chance prices are will be higher ten years from now when you actually need the money?
You shouldn’t, and you wouldn’t if you could talk sense into the fear seizing your lizard brain.
Legal Disclaimer
Trading Justice LLC (“Trading Justice”) is providing this website and any related materials, including newsletters, blog posts, videos, social media postings and any other communications (collectively, the “Materials”) on an “as-is” basis. This means that although Trading Justice strives to make the information accurate, thorough and current, neither Trading Justice nor the author(s) of the Materials or the moderators guarantee or warrant the Materials or accept liability for any damage, loss or expense arising from the use of the Materials, whether based in tort, contract, or otherwise. Tackle Trading is providing the Materials for educational purposes only. We are not providing legal, accounting, or financial advisory services, and this is not a solicitation or recommendation to buy or sell any stocks, options, or other financial instruments or investments. Examples that address specific assets, stocks, options or other financial instrument transactions are for illustrative purposes only and are not intended to represent specific trades or transactions that we have conducted. In fact, for the purpose of illustration, we may use examples that are different from or contrary to transactions we have conducted or positions we hold. Furthermore, this website and any information or training herein are not intended as a solicitation for any future relationship, business or otherwise, between the users and the moderators. No express or implied warranties are being made with respect to these services and products. By using the Materials, each user agrees to indemnify and hold Trading Justice harmless from all losses, expenses, and costs, including reasonable attorneys’ fees, arising out of or resulting from user’s use of the Materials. In no event shall Tackle Trading or the author(s) or moderators be liable for any direct, special, consequential or incidental damages arising out of or related to the Materials. If this limitation on damages is not enforceable in some states, the total amount of Trading Justice’s liability to the user or others shall not exceed the amount paid by the user for such Materials.
All investing and trading in the securities market involve a high degree of risk. Any decisions to place trades in the financial markets, including trading in stocks, options or other financial instruments, is a personal decision that should only be made after conducting thorough independent research, including a personal risk and financial assessment, and prior consultation with the user’s investment, legal, tax, and accounting advisers, to determine whether such trading or investment is appropriate for that user.
