We live in a brave new world. Pandemics and quarantines are one thing, but negative prices for a commodity? That is a head-scratcher once thought to be impossible. I remember a time when hillbillies finding oil led to riches and a Beverly Hills mansion. Had they been so unlucky to have stumbled upon black gold in April 2020, they would curse their misfortune.
~Why oh why did we have to find oil on our land?! ~
~How much are we going to have to pay to have this nasty, no good stuff taken off our hands?~
The answer to their question on April 20 of this year was $40 per barrel.
Historic! Unprecedented! Unimaginable
Yet true. We’re living in a time of such dislocation and imbalance in the oil markets that the Beverly Hillbillies would have had to pay some $40 to have someone take each barrel of the volatile, stinky, useless-without-a-refinery commodity off their property.
They would have been better off finding water in their backyard. In this month’s newsletter, we’re investigating oil’s entrance into the twilight zone.
Along the way, you will learn about the interplay between supply and demand, the intricacies of oil ETFs, the curious case of contango, and the riddle that is USO.
Economics 101
We begin with a crash course on economics. The price of freely traded goods is a function of supply and demand. When one exceeds the other, prices move until equilibrium is found. If demand overwhelms supply, then prices rise. If supply is greater than demand, then prices fall.
You see this play out every day in the prices of a million goods and services across the world. Oil included.
We can follow the logic path of oil in two directions. First, we could start with the level of supply and demand and then forecast what the price of oil should be based on both metrics. Second, we could look at the cost of crude and infer what that means about the current tug-of-war between supply and demand. I prefer the second. Think about what negative prices for oil must mean about supply and demand.
- Supply is excessive. Oil is everywhere.
- Demand is dead – murdered by a silent killer.
Let’s look at the forces driving each, starting with demand.
The Silent Killer
There is no debate on who oil’s murderer is – no need for the blame game or a round of Clue. It is the coronavirus pandemic and the flurry of lockdowns and shelter-in-place orders echoing across the globe. The economic engine was humming moderately well as it entered 2020, but Covid-19 changed everything. Mobility died, and so too did oil demand. Parked cars and grounded planes are the demons haunting oil’s dreams.
According to the April 2020 IEA Oil Market Report, “demand for April is estimated to be 29 million barrels a day less than a year ago.” That places it down to levels not seen since 1995! The report further stated, “Even assuming that travel restrictions are eased in the second half of the year, we expect that global oil demand in 2020 will fall by 9.3 million barrels a day (mb/d) versus 2019, erasing almost a decade of growth.”
Unfortunately, the historic demand shock wasn’t the only black swan pecking out oil’s eyes. In the face of an epic plunge in consumption, oil producers not only didn’t slow production, they turned the spigot on full blast!
The result of the toxic combination wasn’t just cheap oil. It wasn’t even free oil. It was free oil plus a pair of Jacksons for each blasted barrel you were willing to take.
Turn it off, Turn it off!
If you’ve been hunkering down with your hoarded toilet paper, you might have missed the news that a war started between Saudi Arabia and Russia. It wasn’t a military skirmish. It was an economic one. For all the tantalizing details, we suggest a simple google search of “oil price war.” You’ll be in for an enlightening afternoon. Here’s the gist. Oil prices were reeling earlier this year in response to the pandemic.In March, OPEC agreed on production cuts to help oil prices stabilize and then calledon Russia to abide by the decision. Putin and pals said no. Saudi Arabia responded by cutting its prices and later increasing production to put the screws to Russia. Russia then countered with a production boost of its own. And the race to zero was off.
Here was the net effect. Production from OPEC ramped by 1.73 million barrels a day in April, which is the largest monthly increase since September 1990. And, according to Bloomberg calculations, the war added almost 100 million barrels of supply to a market that was already drowning in oil.
Trading Oil
Oil trades in what is known as the futures market. When you hear the price of oil quoted in the media, they are referring to the spot price of a barrel of crude oil. There are different types or grades of oil, but the most followed and traded by speculators is West Texas Intermediate or WTI. It is also known as light sweet crude oil. The “light” descriptor comes from its low density, and the “sweet”comes from its low sulfur content.
If you want to speculate on oil, you have a variety of tools at your disposal, each with its varying nuances. Here is a brief intro to each.
Futures & Futures Options
Professionals swinging big portfolios trade oil futures and futures options. They offerbig-league leverage and are only appropriate for the most sophisticated of traders. The cost of a futures contract varies over time, depending on things like volatility and the underlying asset’s price. As of May 2020, the cost for a single contract was around $27,000. Like we said, not for the small fry.
Options on futures have the potential to take the leverage up another level. You are trading a leveraged derivative on a leveraged underlying. Needless to say, you’ll want to tread carefully with these exotic instruments.
Oil Stocks
Perhaps the most common vehicle for the everyday investor to acquire exposure to energy in their portfolio is by purchasing shares in an oil company. The energy sector houses a handful of industries including exploration & production, drilling, equipment & services, storage & transportation, and refining & marketing.
Because they all surround the oil ecosystem, the fate of energy stocks is tied to that of crude prices. In trader-speak, we say that energy stocks have a positive correlation with oil. As goes black gold, so goes energy stocks.
You can imagine, then, the damage inflicted on these companies by crashing crude prices. It has been a veritable bloodbath with few stocks escaping the carnage. The lot of them have fallen anywhere from 60% to 90%. Some, like Diamond Offshore and Whiting Petroleum, have already gone belly up. Many analysts are predicting dozens, if not hundreds of more bankruptcies to come.
The game of stock picking offers high risk and high reward. You could traverse the safer route and stick with the largest players with the best access to capital and a history of weathering economic downturns. We are talking about the Exxon Mobils and Chevrons of the world. Or, you could tread the riskier path by dumpster diving for the hardest hit, nastiest-looking energy companies. If they survive, the upside could be huge. But if they don’t, well, then kiss your money goodbye.
Oil Stock ETFs
Admittedly, picking individual stocks can be challenging. So, instead, why not just buy the entire sector? You can do this with exchange-traded funds or ETFs. Like a mutual fund, ETFs allow you to buy a diversified basket of stocks. That way, if a few companies get put into the grave, it won’t destroy the entire fund. When it comes tothe energy sector, there are dozens of funds that own oil stocks. But, only a few of them have sufficient liquidity to justify trading, particularly if you are using options contracts. Here are the top three:
- Energy Select Sector SPDR (XLE)
- Oil & Gas Explore & Prod. (XOP)
- Vaneck Vectors/Oil Services ETF (OIH)
Let’s look at the summary of each.
XLE – Heavily weighted toward large-cap oil producers. Chevron and Exxon Mobil make up 45% of the fund.
XOP – Offers exposure to the exploration and production segments of the oil and gasindustry. It holds around 55 stocks with the components more equally weighted thanXLE. No single holding comprises more than 6.6% of the fund.
OIH – Holds 24 oil services companies. Over 40% of the fund is in the top five holdings with Schlumberger (SLB) and Halliburton (HAL) holding the most weight.
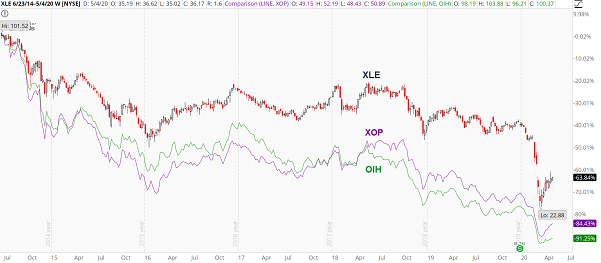
In sizing up the performance of each, we’ve elected to use June 2014 as our starting point. That month marked the record high for all funds. Though it was only six years ago, oil was in a completely different universe back then. The accompanying graphic shows the trio crashing between 63% and 91%. The carnage has been utterly breathtaking. If you’re wondering why XLE has held up so much better than the other two, it’s due to the heavy weighting in Exxon and Chevron. They’re the biggest players and have held up worlds better than the smaller companies.
From Prince to Pauper
Another way to illustrate the secular decline of energy is to view its sector weighting in the S&P 500. In June 2008, when energy stocks were booming beside $145 oil, the energy sector had the second-largest weighting in the S&P 500 at 15.96% and was less than 1% from the biggest at the time – Technology. Since then, it has completely unraveled. The accompanying chart shows its ranking back to 1990. (Source: Bespoke)
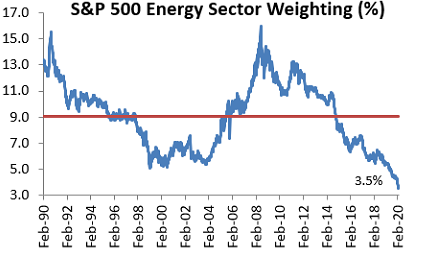
And it has gotten worse since February, sinking to 2.94%.
To recap, you have three primary vehicles at your disposal if you are inclined to trade oil – futures and futures options, oil stocks, and oil stock ETFs.
But there is another instrument. It is fascinating, hotly contested, and has taken in billions in assets under management over the past month as the crash whipped speculators into a frenzy. Let’s talk about the United States Oil Fund.
The USO Story
USO is an exchange-traded product initially designed to track the price movement of front-month WTI oil futures contracts. Oil plunging below zero has since caused the fund to alter the way it attempts to track the commodity, but we’ll get into that mud pit a little later. The beauty of USO – at least in theory – is it allowed stock traders to speculate on oil prices without having to open a futures trading account and deal with the increased leverage and volatility of derivatives.
If you are going to understand why USO behaves the way it does, then you have first to grasp the intricacies of futures contracts. The dynamic that is most important for this discussion is called term structure.
Term structure refers to the relationship between futures contracts and different expirations. In the case of crude oil, it reflects how the price of oil changes as you move from one expiration cycle to the next. Consider the following screenshot displaying light sweet crude oil futures (/CL) from June through October. Take note of how the price of oil futures (blue box) is rising as we move further out in time. June is trading for $20.16, July for $22.43, Aug for $24.26, September for $25.72, and, finally, October for $26.88.

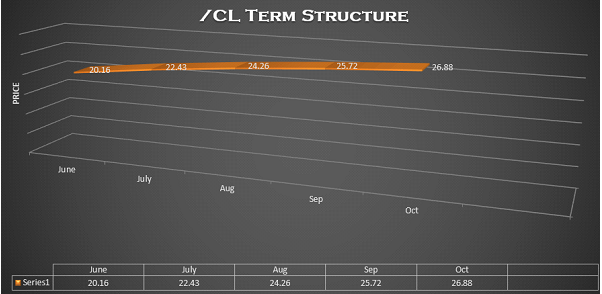
Notice how the term structure is upward sloping? In trader jargon, this is called contango. In other words, the front-month futures are trading at a discount to back month futures. For the oil markets, this is common. Typically, back month futures do trade at higher levels than the front month.
Occasionally, the term structure inverts so that front-month futures are trading at a premium to back month ones. When the curve is downward sloping like this, it’s called backwardation.
The Contango Curse
Now, here’s where the term structure comes into play for USO.
The United States Oil Fund doesn’t derive its value directly from the spot price of crude oil. It’s not like the fund owns a massive warehouse or a tanker full of oil barrels. And, by the way, if it did, there would be storage costs incurred that would necessarily cause the fund to underperform the spot price of oil over time. But, again, it does not own physical crude. Instead, it uses futures contracts. And, since these instruments expire, the fund must continuously roll them forward to maintain its exposure.
Before the recent changes it made in response to May expiration driving futures into negative territory, this is how rolling would work. Let’s say it’s July, and USO owns a bunch of August contracts. Sometime between now and expiration, the fund would have to sell the August futures it owns and buy September contracts. It then repeats the process before September expiration by rolling to October, and so on. If September futures were trading for the same price as August futures, there wouldn’t be a credit or debit associated with the roll. USO would sell the Aug contracts for, say, $20 and then buy the Sep futures for the same $20 – effectively swapping one for the other at even money.
But in situations where the term structure is in contango or backwardation, this isn’t the case. With the former, USO incurs a cost most of the time when rebalancing. Right now, for example, it would be selling the June contracts for $20.16 and buying July for $22.43.
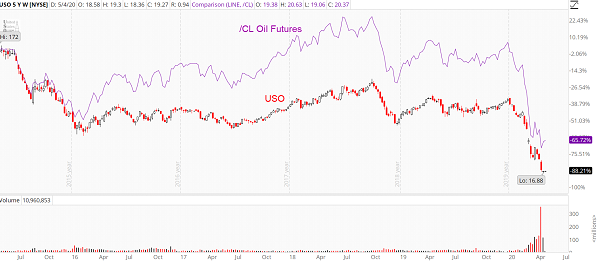
On a day to day basis, the roll cost’s effect is virtually imperceptible. But over time, it weighs on USO, causing the fund’s performance to diverge significantly from the actual price of crude oil. It’s worth mentioning that if crude oil futures are in backwardation, it’ll act as a tailwind for USO. Though they are rare, periods of backwardation lead to outperformance from USO.
Consider the following chart overlay showing the spot price of oil in purple versus USO in red.

Yet another source of drag on USO’s performance is its expense ratio. Though its effects pale in comparison to the contango driven drag, it still has an impact. The current annual expense ratio is 0.73%, which means every year you’re paying roughly three-quarters of a percent just for the privilege of owning the fund.
Instead of rising, say 10%, over the year, USO would increase 9.27% once the expense ratio is considered. This is a built-in feature of all ETFs causing them to underperform their benchmarks right out of the gate.
A Riddle Wrapped In a Mystery Inside an Enigma
For virtually the entirety of its existence, USO has focused on owning front-month contracts. The rationale was simple. Front-month futures more closely track the spot price of oil than any other contract. If your objective is to provide investors with exposure to the cost of oil they see quoted in the media and followed by the masses, then it makes sense to use the contract that best mimics that value.
Unfortunately, April’s historic crash threw a wrench into the wisdom of getting stuck in front-month futures. As a result, the stewards at the helm decided to pivot by diversifying their holdings. Instead of just front-month futures, they are now buying contracts that expire anywhere between one month and one year from now. But that’s not all, they also have stated they can purchase other oil-related products too. Fortunately, the fund has been transparent with its change. If you go to the home page for USO (http://www.uscfinvestments.com/uso), you’ll find the following notification:

If you want to view their target portfolio or current holdings to confirm what type of exposure you’re getting when buying USO (at least on that day – remember it changes all the time), then you can find it here: http://www.uscfinvestments.com/holdings/uso
Here’s a snapshot of the current target portfolio:
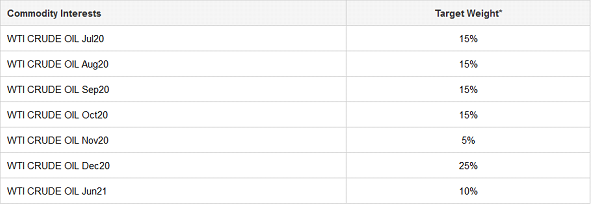
Before the adjustments mentioned above in response to the oil crash, the USO portfolio was much, much simpler. The above table would essentially be 100% in Jul20 contracts if they were the front month.
The new structure of the fund is the precise reason why USO has lagged the spot price of oil over the past month. Because crude has rebounded aggressively into the first week of May, it’s one-month performance was only negative 22%. By contrast, USO was still down 56%. That’s because the spot price of crude oil is tracking July contracts. And only 15% of USO is exposed to July. The other 85% is in longer-dated futures, which haven’t rebounded near as aggressively. Unfortunately, you should fully expect this type of discrepancy to persist moving forward.
Every week USCF has been filing a Form 8-K to outline all the details of the events driving their evolving portfolio structure. You can find them here: http://www.uscfinvestments.com/resources-filings/commodities/uso
Here are a few excerpts from the April 27th report that are important (we bolded the critical section):
“As described in USO’s prospectus, USO, in addition to investing in the Benchmark Oil Futures Contract, may also seek to achieve its investment objective by investing primarily in other futures contracts for light, sweet crude oil, other types of crude oil, diesel-heating oil, gasoline, natural gas, and other petroleum-based fuels that are traded on the NYMEX, ICE Futures or other U.S. and foreign exchanges…”
Our interpretation: USO has the right to buy a whole bunch of other stuff in addition to front-month oil futures (aka “Benchmark Oil Futures Contract”).
“While it is USO’s expectation that at some point in the future it will be able to return to primarily investing in the Benchmark Futures Contract or other similar futures contracts of the same tenor based on light, sweet crude oil, there can be no guarantee of when, if ever, that will occur. As a result, investors in USO should expect that there will be continued deviations between the performance of USO’s investments and the Benchmark Oil Futures Contract, and that USO may not be able to track the Benchmark Oil Futures Contract or meet its investment objective, which is for the daily percentage changes in the NAV per share to reflect the daily percentage changes of the spot price of light, sweet crude oil, as measured by the daily percentage changes in the price of Benchmark Oil Futures Contract, plus interest earned on USO’s collateral holdings, less USO’s expenses. The inability to closely track the Benchmark Oil Futures Contract and the impact of higher levels of contango will impact the performance of USO and the value of its shares.”
TJ Newsletter interpretation: USO may or may not track crude oil. You’ve been warned.
Here’s the takeaway. USO has all of a sudden become a very complicated product. It now requires greater due diligence and a deeper understanding of how the futures market works. Ultimately, that means it’s a product that is inappropriate for all but the most sophisticated of investors.
For everyone else, oil stocks and oil stock-based ETFs are probably the best avenues for exposure to energy.

 Jonny Wichman
May 12, 2020 at 11:57 AMThanks for breaking down the extremely complex oil situation. Very timely and very helpful.
Jonny W.
 Tyler Craig
May 12, 2020 at 1:08 PMMy pleasure, Jonny!